
Research ArticleCell biologyNephrology
Open Access |  10.1172/jci.insight.199341
Failure of endocytic flux in Donnai-Barrow syndrome caused by LRP2 p.C1400R
Andrew Beenken,1 Tian H. Shen,1 Aryan Ghotra,1 Hediye Erdjument-Bromage,2 Jeong Lee,1 Jared S. Kushner,3 Rachel E. Sturley,1 Atlas Khan,1 Jeffrey R. Arace,1 Leora Kronenberg,1 Lucy D. Shen,1 Gabriel H. Rahmani,1 Patricia K. Donahoe,4 Thomas A. Neubert,2 Frances A. High,4,5 Ora A. Weisz,6 and Jonathan Barasch1
1Division of Nephrology, Columbia University Vagelos College of Physicians and Surgeons, New York, New York, USA.
2Department of Neuroscience, NYU Grossman School of Medicine, New York, New York, USA.
3Division of Cardiology, Columbia University Vagelos College of Physicians and Surgeons, New York, New York, USA.
4Pediatric Surgical Research Laboratories and Department of Surgery, Massachusetts General Hospital and Harvard Medical School, Boston, Massachusetts, USA.
5Department of Pediatrics, Massachusetts General Hospital, Boston, Massachusetts, USA.
6Renal-Electrolyte Division, University of Pittsburgh School of Medicine, Pittsburgh, Pennsylvania, USA.
Address correspondence to: Jonathan Barasch or Andrew Beenken, Columbia University Irving Medical Center, 622 West 168th Street 4th Floor, New York, New York 10032, USA. Phone: 917.671.6081; Email: jmb4@cumc.columbia.edu (JB). Phone: 646.763.2851; Email: ab3890@cumc.columbia.edu (AB).
Find articles by Beenken, A. in: PubMed | Google Scholar
1Division of Nephrology, Columbia University Vagelos College of Physicians and Surgeons, New York, New York, USA.
2Department of Neuroscience, NYU Grossman School of Medicine, New York, New York, USA.
3Division of Cardiology, Columbia University Vagelos College of Physicians and Surgeons, New York, New York, USA.
4Pediatric Surgical Research Laboratories and Department of Surgery, Massachusetts General Hospital and Harvard Medical School, Boston, Massachusetts, USA.
5Department of Pediatrics, Massachusetts General Hospital, Boston, Massachusetts, USA.
6Renal-Electrolyte Division, University of Pittsburgh School of Medicine, Pittsburgh, Pennsylvania, USA.
Address correspondence to: Jonathan Barasch or Andrew Beenken, Columbia University Irving Medical Center, 622 West 168th Street 4th Floor, New York, New York 10032, USA. Phone: 917.671.6081; Email: jmb4@cumc.columbia.edu (JB). Phone: 646.763.2851; Email: ab3890@cumc.columbia.edu (AB).
Find articles by Shen, T. in: PubMed | Google Scholar
1Division of Nephrology, Columbia University Vagelos College of Physicians and Surgeons, New York, New York, USA.
2Department of Neuroscience, NYU Grossman School of Medicine, New York, New York, USA.
3Division of Cardiology, Columbia University Vagelos College of Physicians and Surgeons, New York, New York, USA.
4Pediatric Surgical Research Laboratories and Department of Surgery, Massachusetts General Hospital and Harvard Medical School, Boston, Massachusetts, USA.
5Department of Pediatrics, Massachusetts General Hospital, Boston, Massachusetts, USA.
6Renal-Electrolyte Division, University of Pittsburgh School of Medicine, Pittsburgh, Pennsylvania, USA.
Address correspondence to: Jonathan Barasch or Andrew Beenken, Columbia University Irving Medical Center, 622 West 168th Street 4th Floor, New York, New York 10032, USA. Phone: 917.671.6081; Email: jmb4@cumc.columbia.edu (JB). Phone: 646.763.2851; Email: ab3890@cumc.columbia.edu (AB).
Find articles by Ghotra, A. in: PubMed | Google Scholar
1Division of Nephrology, Columbia University Vagelos College of Physicians and Surgeons, New York, New York, USA.
2Department of Neuroscience, NYU Grossman School of Medicine, New York, New York, USA.
3Division of Cardiology, Columbia University Vagelos College of Physicians and Surgeons, New York, New York, USA.
4Pediatric Surgical Research Laboratories and Department of Surgery, Massachusetts General Hospital and Harvard Medical School, Boston, Massachusetts, USA.
5Department of Pediatrics, Massachusetts General Hospital, Boston, Massachusetts, USA.
6Renal-Electrolyte Division, University of Pittsburgh School of Medicine, Pittsburgh, Pennsylvania, USA.
Address correspondence to: Jonathan Barasch or Andrew Beenken, Columbia University Irving Medical Center, 622 West 168th Street 4th Floor, New York, New York 10032, USA. Phone: 917.671.6081; Email: jmb4@cumc.columbia.edu (JB). Phone: 646.763.2851; Email: ab3890@cumc.columbia.edu (AB).
Find articles by Erdjument-Bromage, H. in: PubMed | Google Scholar
1Division of Nephrology, Columbia University Vagelos College of Physicians and Surgeons, New York, New York, USA.
2Department of Neuroscience, NYU Grossman School of Medicine, New York, New York, USA.
3Division of Cardiology, Columbia University Vagelos College of Physicians and Surgeons, New York, New York, USA.
4Pediatric Surgical Research Laboratories and Department of Surgery, Massachusetts General Hospital and Harvard Medical School, Boston, Massachusetts, USA.
5Department of Pediatrics, Massachusetts General Hospital, Boston, Massachusetts, USA.
6Renal-Electrolyte Division, University of Pittsburgh School of Medicine, Pittsburgh, Pennsylvania, USA.
Address correspondence to: Jonathan Barasch or Andrew Beenken, Columbia University Irving Medical Center, 622 West 168th Street 4th Floor, New York, New York 10032, USA. Phone: 917.671.6081; Email: jmb4@cumc.columbia.edu (JB). Phone: 646.763.2851; Email: ab3890@cumc.columbia.edu (AB).
Find articles by Lee, J. in: PubMed | Google Scholar
1Division of Nephrology, Columbia University Vagelos College of Physicians and Surgeons, New York, New York, USA.
2Department of Neuroscience, NYU Grossman School of Medicine, New York, New York, USA.
3Division of Cardiology, Columbia University Vagelos College of Physicians and Surgeons, New York, New York, USA.
4Pediatric Surgical Research Laboratories and Department of Surgery, Massachusetts General Hospital and Harvard Medical School, Boston, Massachusetts, USA.
5Department of Pediatrics, Massachusetts General Hospital, Boston, Massachusetts, USA.
6Renal-Electrolyte Division, University of Pittsburgh School of Medicine, Pittsburgh, Pennsylvania, USA.
Address correspondence to: Jonathan Barasch or Andrew Beenken, Columbia University Irving Medical Center, 622 West 168th Street 4th Floor, New York, New York 10032, USA. Phone: 917.671.6081; Email: jmb4@cumc.columbia.edu (JB). Phone: 646.763.2851; Email: ab3890@cumc.columbia.edu (AB).
Find articles by
Kushner, J.
in:
PubMed
|
Google Scholar
|

1Division of Nephrology, Columbia University Vagelos College of Physicians and Surgeons, New York, New York, USA.
2Department of Neuroscience, NYU Grossman School of Medicine, New York, New York, USA.
3Division of Cardiology, Columbia University Vagelos College of Physicians and Surgeons, New York, New York, USA.
4Pediatric Surgical Research Laboratories and Department of Surgery, Massachusetts General Hospital and Harvard Medical School, Boston, Massachusetts, USA.
5Department of Pediatrics, Massachusetts General Hospital, Boston, Massachusetts, USA.
6Renal-Electrolyte Division, University of Pittsburgh School of Medicine, Pittsburgh, Pennsylvania, USA.
Address correspondence to: Jonathan Barasch or Andrew Beenken, Columbia University Irving Medical Center, 622 West 168th Street 4th Floor, New York, New York 10032, USA. Phone: 917.671.6081; Email: jmb4@cumc.columbia.edu (JB). Phone: 646.763.2851; Email: ab3890@cumc.columbia.edu (AB).
Find articles by Sturley, R. in: PubMed | Google Scholar
1Division of Nephrology, Columbia University Vagelos College of Physicians and Surgeons, New York, New York, USA.
2Department of Neuroscience, NYU Grossman School of Medicine, New York, New York, USA.
3Division of Cardiology, Columbia University Vagelos College of Physicians and Surgeons, New York, New York, USA.
4Pediatric Surgical Research Laboratories and Department of Surgery, Massachusetts General Hospital and Harvard Medical School, Boston, Massachusetts, USA.
5Department of Pediatrics, Massachusetts General Hospital, Boston, Massachusetts, USA.
6Renal-Electrolyte Division, University of Pittsburgh School of Medicine, Pittsburgh, Pennsylvania, USA.
Address correspondence to: Jonathan Barasch or Andrew Beenken, Columbia University Irving Medical Center, 622 West 168th Street 4th Floor, New York, New York 10032, USA. Phone: 917.671.6081; Email: jmb4@cumc.columbia.edu (JB). Phone: 646.763.2851; Email: ab3890@cumc.columbia.edu (AB).
Find articles by Khan, A. in: PubMed | Google Scholar
1Division of Nephrology, Columbia University Vagelos College of Physicians and Surgeons, New York, New York, USA.
2Department of Neuroscience, NYU Grossman School of Medicine, New York, New York, USA.
3Division of Cardiology, Columbia University Vagelos College of Physicians and Surgeons, New York, New York, USA.
4Pediatric Surgical Research Laboratories and Department of Surgery, Massachusetts General Hospital and Harvard Medical School, Boston, Massachusetts, USA.
5Department of Pediatrics, Massachusetts General Hospital, Boston, Massachusetts, USA.
6Renal-Electrolyte Division, University of Pittsburgh School of Medicine, Pittsburgh, Pennsylvania, USA.
Address correspondence to: Jonathan Barasch or Andrew Beenken, Columbia University Irving Medical Center, 622 West 168th Street 4th Floor, New York, New York 10032, USA. Phone: 917.671.6081; Email: jmb4@cumc.columbia.edu (JB). Phone: 646.763.2851; Email: ab3890@cumc.columbia.edu (AB).
Find articles by Arace, J. in: PubMed | Google Scholar
1Division of Nephrology, Columbia University Vagelos College of Physicians and Surgeons, New York, New York, USA.
2Department of Neuroscience, NYU Grossman School of Medicine, New York, New York, USA.
3Division of Cardiology, Columbia University Vagelos College of Physicians and Surgeons, New York, New York, USA.
4Pediatric Surgical Research Laboratories and Department of Surgery, Massachusetts General Hospital and Harvard Medical School, Boston, Massachusetts, USA.
5Department of Pediatrics, Massachusetts General Hospital, Boston, Massachusetts, USA.
6Renal-Electrolyte Division, University of Pittsburgh School of Medicine, Pittsburgh, Pennsylvania, USA.
Address correspondence to: Jonathan Barasch or Andrew Beenken, Columbia University Irving Medical Center, 622 West 168th Street 4th Floor, New York, New York 10032, USA. Phone: 917.671.6081; Email: jmb4@cumc.columbia.edu (JB). Phone: 646.763.2851; Email: ab3890@cumc.columbia.edu (AB).
Find articles by Kronenberg, L. in: PubMed | Google Scholar
1Division of Nephrology, Columbia University Vagelos College of Physicians and Surgeons, New York, New York, USA.
2Department of Neuroscience, NYU Grossman School of Medicine, New York, New York, USA.
3Division of Cardiology, Columbia University Vagelos College of Physicians and Surgeons, New York, New York, USA.
4Pediatric Surgical Research Laboratories and Department of Surgery, Massachusetts General Hospital and Harvard Medical School, Boston, Massachusetts, USA.
5Department of Pediatrics, Massachusetts General Hospital, Boston, Massachusetts, USA.
6Renal-Electrolyte Division, University of Pittsburgh School of Medicine, Pittsburgh, Pennsylvania, USA.
Address correspondence to: Jonathan Barasch or Andrew Beenken, Columbia University Irving Medical Center, 622 West 168th Street 4th Floor, New York, New York 10032, USA. Phone: 917.671.6081; Email: jmb4@cumc.columbia.edu (JB). Phone: 646.763.2851; Email: ab3890@cumc.columbia.edu (AB).
Find articles by Shen, L. in: PubMed | Google Scholar
1Division of Nephrology, Columbia University Vagelos College of Physicians and Surgeons, New York, New York, USA.
2Department of Neuroscience, NYU Grossman School of Medicine, New York, New York, USA.
3Division of Cardiology, Columbia University Vagelos College of Physicians and Surgeons, New York, New York, USA.
4Pediatric Surgical Research Laboratories and Department of Surgery, Massachusetts General Hospital and Harvard Medical School, Boston, Massachusetts, USA.
5Department of Pediatrics, Massachusetts General Hospital, Boston, Massachusetts, USA.
6Renal-Electrolyte Division, University of Pittsburgh School of Medicine, Pittsburgh, Pennsylvania, USA.
Address correspondence to: Jonathan Barasch or Andrew Beenken, Columbia University Irving Medical Center, 622 West 168th Street 4th Floor, New York, New York 10032, USA. Phone: 917.671.6081; Email: jmb4@cumc.columbia.edu (JB). Phone: 646.763.2851; Email: ab3890@cumc.columbia.edu (AB).
Find articles by Rahmani, G. in: PubMed | Google Scholar
1Division of Nephrology, Columbia University Vagelos College of Physicians and Surgeons, New York, New York, USA.
2Department of Neuroscience, NYU Grossman School of Medicine, New York, New York, USA.
3Division of Cardiology, Columbia University Vagelos College of Physicians and Surgeons, New York, New York, USA.
4Pediatric Surgical Research Laboratories and Department of Surgery, Massachusetts General Hospital and Harvard Medical School, Boston, Massachusetts, USA.
5Department of Pediatrics, Massachusetts General Hospital, Boston, Massachusetts, USA.
6Renal-Electrolyte Division, University of Pittsburgh School of Medicine, Pittsburgh, Pennsylvania, USA.
Address correspondence to: Jonathan Barasch or Andrew Beenken, Columbia University Irving Medical Center, 622 West 168th Street 4th Floor, New York, New York 10032, USA. Phone: 917.671.6081; Email: jmb4@cumc.columbia.edu (JB). Phone: 646.763.2851; Email: ab3890@cumc.columbia.edu (AB).
Find articles by Donahoe, P. in: PubMed | Google Scholar
1Division of Nephrology, Columbia University Vagelos College of Physicians and Surgeons, New York, New York, USA.
2Department of Neuroscience, NYU Grossman School of Medicine, New York, New York, USA.
3Division of Cardiology, Columbia University Vagelos College of Physicians and Surgeons, New York, New York, USA.
4Pediatric Surgical Research Laboratories and Department of Surgery, Massachusetts General Hospital and Harvard Medical School, Boston, Massachusetts, USA.
5Department of Pediatrics, Massachusetts General Hospital, Boston, Massachusetts, USA.
6Renal-Electrolyte Division, University of Pittsburgh School of Medicine, Pittsburgh, Pennsylvania, USA.
Address correspondence to: Jonathan Barasch or Andrew Beenken, Columbia University Irving Medical Center, 622 West 168th Street 4th Floor, New York, New York 10032, USA. Phone: 917.671.6081; Email: jmb4@cumc.columbia.edu (JB). Phone: 646.763.2851; Email: ab3890@cumc.columbia.edu (AB).
Find articles by
Neubert, T.
in:
PubMed
|
Google Scholar
|
1Division of Nephrology, Columbia University Vagelos College of Physicians and Surgeons, New York, New York, USA.
2Department of Neuroscience, NYU Grossman School of Medicine, New York, New York, USA.
3Division of Cardiology, Columbia University Vagelos College of Physicians and Surgeons, New York, New York, USA.
4Pediatric Surgical Research Laboratories and Department of Surgery, Massachusetts General Hospital and Harvard Medical School, Boston, Massachusetts, USA.
5Department of Pediatrics, Massachusetts General Hospital, Boston, Massachusetts, USA.
6Renal-Electrolyte Division, University of Pittsburgh School of Medicine, Pittsburgh, Pennsylvania, USA.
Address correspondence to: Jonathan Barasch or Andrew Beenken, Columbia University Irving Medical Center, 622 West 168th Street 4th Floor, New York, New York 10032, USA. Phone: 917.671.6081; Email: jmb4@cumc.columbia.edu (JB). Phone: 646.763.2851; Email: ab3890@cumc.columbia.edu (AB).
Find articles by High, F. in: PubMed | Google Scholar
1Division of Nephrology, Columbia University Vagelos College of Physicians and Surgeons, New York, New York, USA.
2Department of Neuroscience, NYU Grossman School of Medicine, New York, New York, USA.
3Division of Cardiology, Columbia University Vagelos College of Physicians and Surgeons, New York, New York, USA.
4Pediatric Surgical Research Laboratories and Department of Surgery, Massachusetts General Hospital and Harvard Medical School, Boston, Massachusetts, USA.
5Department of Pediatrics, Massachusetts General Hospital, Boston, Massachusetts, USA.
6Renal-Electrolyte Division, University of Pittsburgh School of Medicine, Pittsburgh, Pennsylvania, USA.
Address correspondence to: Jonathan Barasch or Andrew Beenken, Columbia University Irving Medical Center, 622 West 168th Street 4th Floor, New York, New York 10032, USA. Phone: 917.671.6081; Email: jmb4@cumc.columbia.edu (JB). Phone: 646.763.2851; Email: ab3890@cumc.columbia.edu (AB).
Find articles by Weisz, O. in: PubMed | Google Scholar
1Division of Nephrology, Columbia University Vagelos College of Physicians and Surgeons, New York, New York, USA.
2Department of Neuroscience, NYU Grossman School of Medicine, New York, New York, USA.
3Division of Cardiology, Columbia University Vagelos College of Physicians and Surgeons, New York, New York, USA.
4Pediatric Surgical Research Laboratories and Department of Surgery, Massachusetts General Hospital and Harvard Medical School, Boston, Massachusetts, USA.
5Department of Pediatrics, Massachusetts General Hospital, Boston, Massachusetts, USA.
6Renal-Electrolyte Division, University of Pittsburgh School of Medicine, Pittsburgh, Pennsylvania, USA.
Address correspondence to: Jonathan Barasch or Andrew Beenken, Columbia University Irving Medical Center, 622 West 168th Street 4th Floor, New York, New York 10032, USA. Phone: 917.671.6081; Email: jmb4@cumc.columbia.edu (JB). Phone: 646.763.2851; Email: ab3890@cumc.columbia.edu (AB).
Find articles by
Barasch, J.
in:
PubMed
|
Google Scholar
|
Published April 23, 2026 - More info
JCI Insight. 2026;11(12):e199341. https://doi.org/10.1172/jci.insight.199341.
© 2026 Beenken et al. This work is licensed under the Creative Commons Attribution 4.0 International License. To view a copy of this license, visit http://creativecommons.org/licenses/by/4.0/.
Received: August 20, 2025; Accepted: April 20, 2026

-
Results
The DBS urinary proteome reveals a shared pattern of LMW proteinuria across variants. To define the urinary proteome associated with DBS, liquid chromatography/tandem mass spectrometry (LC-MS/MS) analysis was performed on urine samples from 9 children with DBS and 8 healthy parental controls (Table 1 and Supplemental Figure 1; supplemental material available online with this article; https://doi.org/10.1172/jci.insight.199341DS1). Of the 9 children, 8 harbored frameshift, splice site, or nonsense mutations, while 1 child had a missense variant, LRP2 p.C1400R, detected in only a single allele. This patient is presumed to be a compound heterozygote with the second allele remaining unidentified by exome sequencing. Thus, an additional mutation may contribute to the phenotype in this patient. All had clinically confirmed DBS (Frances A. High and Patricia K. Donahoe, unpublished observations). Statistical comparison between the DBS and control groups revealed 81 proteins with significantly altered abundance by Welch’s 2-tailed t test with Benjamini-Hochberg correction (BH-FDR q < 0.01) conducted on log2-transformed intensity data (Figure 1A), with an additional 105 proteins identified as significant by Fisher’s exact test for proteins with intensity data too sparse for t test analysis (Supplemental Figure 2). Many of the proteins identified in DBS urine are classical LRP2 ligands, including retinol-binding protein 4 (RBP4), lipoprotein lipase (LPL), angiotensinogen (AGT), β2-microglobulin (B2M), lipocalin-2 (LCN2), antithrombin III (SERPINC1), and α1-microglobulin (AMBP) (18). These results are consistent with published reports of the urinary proteome of megalin-knockdown mouse models (85).
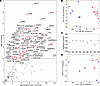 Figure 1
Donnai-Barrow syndrome has a consistent proteomic signature. (A) Log2(experiment/control) of intensities is plotted against –log10(q value) for proteins detected in the urine of 9 children with Donnai-Barrow syndrome (DBS) compared with 8 parental controls with P values from Welch’s t test adjusted with Benjamini-Hochberg procedure (BH-FDR; q < 0.01). The 81 significant proteins in this analysis are in red. All significant changes were increases in intensity for proteins in DBS patients relative to controls. (B) Principal component analysis (PCA) for the proteins with intensity data for all patients (red, n = 9) and controls (blue, n = 8). LRP2 p.C1400R is indicated as a triangle. (C) Total significant proteins (BH-FDR q < 0.01) identified by either Welch’s t test or Fisher’s exact test in each experimental sample. LRP2 p.C1400R is sample E5. (D) PCA for the proteins seen in all patients, with females (red, n = 4) and males (blue, n = 5) showing no significant sex effect across PC1 or PC2 by Welch’s t test.
Within the patient cohort, 2 patients had elevated serum creatinine to 1.7 (Table 1), potentially suggesting a glomerular injury or more likely a tubulointerstitial injury from LRP2 LoF in these patients, consistent with the findings in other DBS cohorts (44). While the filtrate normally contains fragments of different proteins (86), the increased presence of tryptic peptides of fibronectin (FN1) as well as COL15A1 in all DBS urines compared with controls may represent a signal for tubulointerstitial fibrotic injury in these patients (Figure 1A) (87–89).
Unsupervised multivariate analysis was conducted on the proteins that had quantifiable intensities across all control and experimental samples, demonstrating a clear separation between the DBS patient group and the control group in a principal component analysis (PCA) (Figure 1B). The urinary proteome of the patient with LRP2 p.C1400R clustered with that of the other DBS variants, indicating a consistent composition of the DBS urinary proteome. This finding was further emphasized by a similar number of significant proteins identified across all experimental samples (Figure 1C). The clustering of the LRP2 p.C1400R variant patient (E5) within the DBS group suggests that this specific missense mutation phenocopies the broader urinary proteomic consequences of LRP2 frameshift, nonsense, and splice site mutations causing DBS (Figure 1, B and C). A sex-stratified PCA of proteins quantifiable in all DBS patients did not reveal systematic sex-based differences in the urinary proteomes of male and female DBS patients (Figure 1D). The similar degree of LMW proteinuria observed across the DBS patient cohort regardless of variant type raised the possibility that distinct molecular defects converge on a common functional failure.
LRP2 p.C1401R localizes to the apical membrane in a CRISPR mouse model. To dissect the pathophysiologic basis of the proteinuric phenotype in the missense variant LRP2 p.C1400R and to test the hypothesis that DBS can result from diverse molecular defects, a knockin CRISPR mouse model of the orthologous murine variant, Lrp2 p.C1401R, was generated (Supplemental Figure 3, A–C).
In both WT and knockin Lrp2 p.C1401R mice, LRP2 and the S1/S2 segment proximal tubule apical brush border marker sodium-glucose cotransporter 2 (SGLT2) (90, 91) preserved their relative localizations, with LRP2 immediately subapical to SGLT2 on immunofluorescence (IF) (Figure 2A). There was no apparent evidence on IF of LRP2 being retained in the endoplasmic reticulum. Quantitative IF using Alexa Fluor 594–conjugated anti-LRP2 showed that LRP2+ fractional area was reduced by 46% in Lrp2 p.C1401R mice compared with WT (WT, 25.2% ± 5.1%; Lrp2 p.C1401R, 13.63% ± 3.3%; P = 6.13 × 10⁻²³ by Welch’s t test; Figure 2, C and D) and was slightly increased relative to the LRP2-haploinsufficient control (Lrp25′CreERT2/+, 11.68% ± 2.1%; P = 6.64 × 10⁻⁴ by Welch’s t test). The conditional-knockout negative control had negligible LRP2 expression (Lrp25′CreERT2/fl, 0.38% ± 1.2%) (Figure 2, C and D).
 Figure 2
LRP2 p.C1401R is expressed apically. (A) Immunofluorescence (IF) for SGLT2 (green) and LRP2 (red) in kidney cryosections from WT Lrp2 (WT) and Lrp2 p.C1401R mice (p.C1401R). The mutant protein shows apical localization in proximal tubules, similarly to WT, and localizes adjacent to SGLT2. Scale bars: 20 μm. Representative images from n = 3 mice. (B) An LRP2 Western blot (WB) of 6 WT post-nuclear supernatant (PNS) samples (W1–W6) and 6 Lrp2 p.C1401R PNS samples (M1–M6), with associated Ponceau S total protein loading control. The asterisk marks the LRP2 band. Representative of n = 3 technical replicates. (C) LRP2 apical expression is assessed with fluorophore-conjugated anti-LRP2 (red). Scale bars: 20 μm. Representative images from n = 3 mice. (D) Quantitation of LRP2 staining of tubule cross sections from C by Welch’s t test. N = 50 tubule cross sections from n = 3 mice from each genotype: WT, p.C1401R, Lrp25′CreERT2/+ (CreERT2/+) as a haploinsufficient control, and Lrp25′CreERT2/fl (CreERT2/f) as a knockout control. Pairwise comparisons are shown for WT versus p.C1401R and p.C1401R versus CreERT2/+ to test the hypothesis that p.C1401R reduces LRP2 expression. (E) Quantitation of LRP2 WB from B, by Welch’s t test; n = 6 WT Lrp2 and n = 6 Lrp2 p.C1401R mice. Box plots display the median (center line) and interquartile range (box boundaries), with whiskers extending to the most extreme data point within 1.5 times the interquartile range; individual data points are overlaid.
Overall LRP2 expression levels in WT and Lrp2 p.C1401R mice were also compared in the post-nuclear supernatant with quantitative Western blot normalized with Ponceau S staining of total protein (92, 93). In a representative technical replicate, normalized LRP2 WT intensity was 1.014 ± 0.272 compared with 0.438 ± 0.128 for LRP2 p.C1401R, a 57% reduction in protein expression in the mutant (P = 0.002 by Welch’s 2-sample t test) (Figure 2, B and E). This finding was reproducible across 3 technical replicates, with a linear mixed model analysis yielding an estimated marginal mean for protein intensity in WT of 31,092 ± 2,818 AU compared with 15,306 ± 2,823 AU in LRP2 p.C1401R, significant using Satterthwaite’s method (P = 0.0007) (94). These results indicate that despite its apical localization, the Lrp2 p.C1401R mouse model exhibits a decrease in steady-state LRP2 protein expression levels, due to either reduced protein stability or failure of protein recycling, leading to degradation.
LRP2 p.C1401R retains the dimeric assembly of WT LRP2 following biosynthesis. Endogenous LRP2 p.C1401R was purified to determine whether it retained the dimeric assembly observed in WT LRP2 or whether it failed to adopt the native WT conformation, thus predisposing it to degradation and reducing apical expression. Endogenous LRP2 p.C1401R was isolated from homozygous mouse kidneys using anion exchange and size exclusion chromatography (SEC) in an analogous protocol to that used for WT LRP2 (61). The SEC chromatogram of LRP2-containing anion exchange fractions demonstrated a peak at a retention volume of 12 mL for LRP2 p.C1401R (Figure 3A, blue tracing) matching that of the dimer peak of the 1.2 MDa LRP2 WT protein (Figure 3A, orange tracing). Western blotting confirmed that LRP2 p.C1401R eluted from SEC similarly to WT (Figure 3B), suggesting that LRP2 p.C1401R retains the dimeric assembly observed in WT LRP2. These results demonstrate that a population of LRP2 p.C1401R navigates the endoplasmic reticulum and Golgi apparatus and undergoes the expected dimerization during protein folding. Thus, the primary pathophysiologic defect in the LRP2 p.C1401R model likely does not lie in LRP2 biosynthesis.
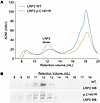 Figure 3
LRP2 p.C1401R folds as a dimer. (A) Size exclusion chromatography (SEC) analysis of LRP2 WT (orange) and LRP2 p.C1401R (blue). The chromatographic peak containing LRP2 is labeled. Representative of n = 3 experiments. (B) LRP2 Western blot (WB) of SEC fractions aligned with the chromatogram in A showing similar elution patterns for WT and LRP2 p.C1401R by anti-LRP2 staining.
To confirm the presence of LRP2 p.C1401R in the protein sample and exclude the possibility that WT LRP2 may be confounding the biochemical analysis, tryptic peptides from an LRP2 p.C1401R preparation were characterized by LC-MS/MS. In WT LRP2, tryptic digestion generates a peptide spanning the region around amino acid 1401 with the sequence TCEDVNECDIPGF1401CSQHCVNMR (calculated monoisotopic mass, MH+1 = 2,728.07 Da, MH2+ = 1,364.54 Da). In LRP2 p.C1401R there is instead the tryptic peptide TCEDVNECDIPGF1401R (calculated monoisotopic mass, MH+1 = 1,711.70 Da, MH2+ = 856.36 Da). Layouts containing predicted experimental masses were created, and total ion current was manually extracted for MS1 peptides at the predicted, doubly charged monoisotopic masses of the LRP2 p.C1401R (Supplemental Figure 4A) and WT LRP2 (Supplemental Figure 4B) peptide spectra. At 52.69 minutes, a clear extracted ion was seen for z = 2 at m/z 856.36 corresponding to the LRP2 p.C1401R peptide spectra (Supplemental Figure 4A), but there was no evidence for the WT LRP2 peptide (m/z 1,364.54, z = 2) (Supplemental Figure 4B). MS2 fragmentation patterns were used to unequivocally demonstrate the presence of the LRP2 p.C1401R peptide. The predicted y ion series (C-terminal directed) and b ion series (N-terminal directed) for the fragmented LRP2 p.C1401R peptide were observed in the data-independent acquisition (DIA) analysis of MS2 spectra in the wide window spanning m/z 856.36 at approximately 52 minutes (Supplemental Figure 4C). Thus, the biochemical behavior of the homozygous LRP2 p.C1401R sample reflects a homogenous protein sample composed entirely of mutant LRP2 with no confounding contamination from WT LRP2.
Lrp2 p.C1401R has evidence of tubular injury despite preserved renal function. Given the gross competency of LRP2 p.C1401R to form a dimeric structure and target the apical membrane, its reduced expression may be associated with broader cellular defects. Since reduced LRP2 expression has been associated with tubular injury (44), we investigated whether signs of injury were evident from histology or injury biomarkers. H&E and periodic acid–Schiff staining showed no gross morphologic abnormalities in Lrp2 p.C1401R kidneys compared with WT (Supplemental Figure 5, A and B). Further evaluation of LRP2 localization with equilibrium ultracentrifugation showed that LRP2, CUBN, and SGLT2 from WT and Lrp2 p.C1401R post-nuclear supernatant exhibited similar fractionation profiles (Supplemental Figure 5C). Renal function was preserved at 4 months of age, with no significant difference in blood urea nitrogen (WT, 21.3 ± 3.4 mg/dL; Lrp2 p.C1401R, 16.0 ± 2.4 mg/dL; not significant by Welch’s t test) (Supplemental Figure 5D) and creatinine below the level of detection, <0.2 mg/dL, in all samples. However, tubular injury markers were increased in mutants, with a 20.4-fold elevation in urinary KIM-1/creatinine ratio by ELISA (WT, 1.3 ± 0.6 ng/mg; Lrp2 p.C1401R, 26.5 ± 9.7 ng/mg; P = 0.013 by Welch’s t test) and qualitatively increased Havcr1 (KIM-1) signal by RNAscope (Supplemental Figure 5, E and F), consistent with prior reports of elevated urinary KIM-1 in DBS patients (44). The expression of KIM-1 in the setting of preserved serum creatinine levels is due to the latter’s insensitivity to subclinical tubular injury.
Receptor-mediated and fluid-phase endocytosis are impaired in Lrp2 p.C1401R mice. Given reduced apical expression of LRP2 in the setting of tubular injury, we assessed the functional competence of the PT in Lrp2 p.C1401R mice. Receptor-mediated endocytosis was directly investigated by detection of uptake following intraperitoneal injection of Alexa Fluor 568–labeled myoglobin, a known LRP2 ligand (74). In Lrp2 p.C1401R mice, Alexa Fluor 568–myoglobin uptake was attenuated in comparison with WT controls (Figure 4A, representative data, n = 3 mice per group). Quantitation by cortical kidney area showed that Alexa-myoglobin–labeled endosomal vesicles constituted 12.2% ± 3.4% of PT area in WT compared with 3.6% ± 0.9% in Lrp2 p.C1401R mice (P = 3.1 × 10⁻²⁴) (Figure 4B).
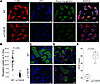 Figure 4
Impairment of receptor-mediated and fluid-phase endocytosis in Lrp2 p.C1401R. (A) Uptake of Alexa Fluor 568–labeled myoglobin (green) following intraperitoneal (i.p.) injection, and IF for cubilin (CUBN, red) and LRP2 (blue), in kidney cryosections from WT Lrp2 and Lrp2 p.C1401R mice (p.C1401R). Myoglobin uptake is attenuated in Lrp2 p.C1401R mice. Scale bars: 10 μm. Representative images from n = 3 mice. (B) Quantitation of myoglobin uptake by area from N = 50 tubular cross sections from n = 3 mice using Welch’s t test. (C) Uptake of FITC-labeled dextran (green) following i.p. injection, with DAPI in blue. Scale bars: 10 μm. Representative images from n = 3 mice. (D) Uptake of Alexa Fluor 594–labeled albumin (red) following i.p. injection, with DAPI in blue and LRP2 in green. Scale bars: 10 μm. Representative images from n = 3 mice. (E) Quantitation of urinary albumin/creatinine ratio (UACR) in WT (n = 4) and p.C1401R mice (n = 4) using Welch’s t test. Box plots display the median (center line) and interquartile range (box boundaries), with whiskers extending to the most extreme data point within 1.5 times the interquartile range; individual data points are overlaid.
Fluid-phase endocytosis was next evaluated following intraperitoneal administration of FITC-dextran. Lrp2 p.C1401R mice showed negligible uptake of FITC-dextran in PT cells compared with WT, pointing to an impairment in fluid-phase endocytosis and a global disturbance in endocytic flux (Figure 4C, representative data, n = 3 mice per group). The general dampening of endocytic flux in the context of Lrp2 p.C1401R is similar to what has been seen in the setting of Lrp2 knockout (60). Uptake of Alexa Fluor 594–conjugated albumin was also negligible in Lrp2 p.C1401R compared with WT (Figure 4D, representative data, n = 3 mice per group), and urinary albumin/creatinine ratio was elevated in Lrp2 p.C1401R mice relative to controls (12.1 ± 2.7 mg/g in WT, 39.7 ± 7.3 mg/g in Lrp2 p.C1401R; P = 0.002 by Welch’s t test) (Figure 4E). The Lrp2 p.C1401R mouse model exhibited proteinuria (Supplemental Figure 6A), with qualitative increases in Coomassie blue staining of LMW proteins in the 25 to 75 kDa range in the mutant across urine samples from 4 separate mice. In contrast, proteinuria in heterozygotes was not qualitatively increased in this range (Supplemental Figure 6A). These findings suggest that the human DBS patient most likely harbors a second deleterious LRP2 allele that was not detected by exome sequencing. Sample loading was controlled with urinary creatinine measurements. Quantitative Western blot showed significant increases in normalized intensity in Lrp2 p.C1401R for retinol-binding protein 4 (RBP4) (WT, 0.005 ± 0.01; Lrp2 p.C1401R, 0.13 ± 0.08; P = 0.045 by Welch’s t test; Supplemental Figure 6B) and lysozyme (LYZ) (WT, –0.02 ± 0.0006; Lrp2 p.C1401R, 0.05 ± 0.03; P = 0.022 by Welch’s t test; Supplemental Figure 6C).
Given the significant difference in receptor-mediated endocytosis between WT and mutant, CUBN localization was interrogated for apical expression in each genotype using colocalization with the S1/S2 marker SGLT2 (90, 91) and the S1/S2/S3 marker Lotus tetragonolobus lectin (LTL) (95). CUBN had apical colocalization with SGLT2 throughout all examined tissue sections (Supplemental Figure 7, A and B, representative images from n = 3 mice). CUBN also exhibited apical colocalization with LTL in SGLT2+ tubules, but in LTL+SGLT2– S3 segment tubules, overall CUBN expression was qualitatively reduced in both WT and mutant, limiting evaluation of apical localization. Reduced CUBN expression in S3 relative to S1/S2 has been previously documented (96). The retained apical localization of CUBN in S1/S2 suggests that perturbed CUBN trafficking is unlikely to underlie the phenotype of the Lrp2 p.C1401R model.
LRP2 p.C1401R and WT are differentially biotinylated by V5-APEX2-RAP. The reduction in receptor-mediated endocytosis suggested the possibility of an impairment in ligand-binding in Lrp2 p.C1401R. Since the scarce quantity of purified endogenous LRP2 p.C1401R precluded quantitative in vitro binding studies, an experimental protocol was developed to test LRP2 p.C1401R ligand binding ex vivo in explanted mouse kidneys perfused with the LRP2 ligand receptor-associated protein (RAP; or LRPAP1) (22, 97) conjugated to V5-tagged ascorbate peroxidase 2 (V5-APEX2) (Supplemental Figure 8, A and B). The V5-APEX2-RAP fusion protein would enable proximity biotinylation of RAP-bound LRP2 p.C1401R at the luminal surface of the PT and provide direct evidence for a retained capacity for ligand binding in Lrp2 p.C1401R. The V5-APEX2-RAP fusion construct was perfused for 25 minutes along with biotin-phenol ex vivo into WT and Lrp2 p.C1401R kidneys followed immediately by a 5-minute pulse of hydrogen peroxide to activate APEX2-mediated proximity biotinylation of proteins situated near bound RAP at the apical surface. This duration of labeling identified primarily apical and early endosomal proteins and largely excluded proteins from the late and recycling endosomal compartments (Table 2).
IF showed clear qualitative differences between WT and Lrp2 p.C1401R in the abundance of biotinylated apical and endocytosed proteins as indicated by streptavidin–Alexa Fluor 488 signal and anti-V5 antibody staining (Figure 5A). Differential quantitation of biotinylated proteins was accomplished with mass spectrometry and demonstrated a 2.97-fold increase in biotinylated LRP2 in WT as compared with Lrp2 p.C1401R mice (Figure 5B). Reduced biotinylation of mutant LRP2 is consistent with its lower overall steady-state expression that was evidenced by Western blot (Figure 2, B and E) and quantitative IF (Figure 2, C and D). The presence of a signal for biotinylated LRP2 p.C1401R suggests that it retains a degree of ligand-binding affinity for RAP (Figure 5, A and B) and that the endocytic defect is likely downstream of the ligand-receptor interaction.
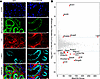 Figure 5
LRP2 p.C1401R and WT are differentially biotinylated by V5-APEX2-RAP. (A) IF of kidney sections from WT and Lrp2 p.C1401R mice (p.C1401R) following ex vivo perfusion with the V5-tagged ascorbate peroxidase 2–receptor-associated protein (V5-APEX2-RAP) fusion construct, with labeling of biotinylated proteins with streptavidin-Alexa Fluor 488 (green), bound V5-APEX2-RAP with anti-V5 (red), and LRP2 (cyan). Gray asterisks mark selected apical membranes for comparison. Scale bars: 10 μm. Representative images from n = 3 mice. (B) Log2(WT/C1401R) fold change (FC) of label-free quantification (LFQ) intensities is plotted against MaxQuant data-independent acquisition analysis (MaxDIA) score for all quantified proteins. Red dots are labeled with mouse gene symbols for proteins with |log2FC| > 1.5 and MaxDIA score > 40. Horizontal dashed lines mark the ±1.5 log2FC thresholds. Key proteins are labeled, including Lrp2 showing increased abundance in WT.
Despite decreased biotinylation of LRP2 p.C1401R, numerous resident proteins in the apical membrane of the mutant exhibited increased labeling by V5-APEX2-RAP, including sodium-glucose cotransporter 1 (SGLT1; log2 fold change [log2FC] –1.36) and dipeptidyl-peptidase 4 (DPP4; log2FC –1.70) (Table 2). It could be speculated that, in the mutant, the V5-APEX2-RAP construct remained at the apical surface longer as a result of slowed endocytosis, and thus nearby membrane proteins were labeled more extensively in the mutant compared with WT. Alternatively, the signal may represent either a true change in LRP2’s near neighbors in the mutant or possibly a change in the activity of APEX2 in the V5-APEX2-RAP fusion protein when it is bound to LRP2 p.C1401R versus WT LRP2.
LRP2 p.C1401R perturbs endocytic flux. The failure of FITC-dextran uptake in the Lrp2 p.C1401R mouse model (Figure 4C) alongside reduced apical expression of LRP2 suggests problems with PT endocytosis broader than receptor-ligand recognition. To evaluate the consequences of LRP2 p.C1401R for endocytic flux, tissue sections were immunolabeled with markers of endocytic compartments, including the early endosome with early endosome antigen 1 (EEA1), the apical recycling endosome (ARE) with RAB11, the common recycling endosome (CRE) with transferrin receptor (TFR1), and lysosomes with lysosomal-associated membrane protein 1 (LAMP1) (Figure 6, representative data from experiments with n = 5 mice per group) (98, 99). Probing the early endosomal compartment for EEA1 revealed an unchanged distribution (Figure 6A), but the distributions of both recycling markers RAB11 and TFR1 showed aberrant localization of these compartments, with the RAB11-labeled ARE restricted to near the apical membrane and the TFR1-labeled CRE restricted to the neighborhood of the basolateral membrane (Figure 6, B and C), reflected in a quantitative increase in the radial distance of TFR1+ endosomes from the tubule center in Lrp2 p.C1401R mice (27.9 ± 9.6 μm) compared with WT (20.0 ± 2.3 μm, P = 7.68 × 10⁻⁸) (Figure 6E). Lysosomes were quantitatively enlarged in Lrp2 p.C1401R mice (10.2% ± 5.4% of PT area) compared with WT (5.4% ± 2.0%, P = 4.25 × 10⁻¹⁰) (Figure 6, D and F), suggesting either a failure of membrane flux through the lysosomal compartment or increased substrate and degradation products within the lysosomes that could not be cleared.
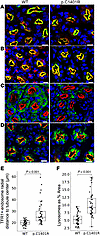 Figure 6
LRP2 p.C1401R perturbs endocytic flux. IF of WT and Lrp2 p.C1401R mice (p.C1401R). (A) Early endosome antigen 1 (EEA1; red) relative abundance and distribution remain unchanged in Lrp2 p.C1401R. LRP2 is in green. Scale bars: 10 μm. (B) RAB11 staining marking the apical recycling endosomes (AREs; red) is mislocalized in Lrp2 p.C1401R. LRP2 is in green. Scale bars: 10 μm. (C) Transferrin receptor 1 (TFR1) staining marking the common recycling endosomes (CREs; green) is redistributed in Lrp2 p.C1401R. LRP2 is in red. Scale bars: 10 μm. (D) Lysosomes marked by lysosomal-associated membrane protein 1 (LAMP1; green) are enlarged. LRP2 is in red. Scale bars: 10 μm. All panels are representative images from n = 5 mice. (E) Quantitation of radial distance from TFR1+ endosomes to the tubule center using Mann-Whitney U test with N = 40 tubule cross sections from n = 5 mice. (F) Quantitation of lysosomal area in Lrp2 p.C1401R mice and WT mice using Mann-Whitney U test with N = 43 tubule cross sections from n = 5 mice. Box plots display the median (center line) and interquartile range (box boundaries), with whiskers extending to the most extreme data point within 1.5 times the interquartile range; individual data points are overlaid.
Structural modeling suggests that steric clashes would inhibit LRP2 p.C1401R recycling. Modeling the LRP2 p.C1401R variant in the context of the published LRP2 extracellular (pH 7.5; Protein Data Bank [PDB] ID: 8EM4) and late endosomal (pH 5.2; PDB ID: 8EM7) structures provides a framework in which to understand the finding that despite LRP2 p.C1401R’s proceeding through biosynthesis to the apical surface, endocytic flux is impaired. The cysteine-to-arginine substitution breaks a disulfide bond and introduces the large, charged side chain of arginine into the center of the fold of the sixth EGF-like repeat (E6) in LRP2. This substitution may disturb the secondary structure of an adjacent β-sheet as well as the geometry of a nearby Ca2+ coordination site (Figure 7A). The introduction of a free cysteine will increase the likelihood of receptor aggregation and degradation, and the disturbance within the hydrophobic core of the domain will change the overall shape of E6. The severe disturbance caused by C1401R within the E6 domain is reflected in a predicted Gibbs free energy change (ΔΔG) of 14.7 kcal/mol as calculated by Pythia (100). However, at extracellular pH, E6 is solvent-exposed and not involved in any intra- or intermolecular contacts within the LRP2 assembly (Figure 7B); thus the mutation may be tolerated during biosynthesis and trafficking to the apical surface. At the pH of the late endosome, the structure of LRP2 is more compact, and the E6 domain is buried within the assembly (Figure 7C), where it is engaged in numerous intramolecular contacts, including with ligand-binding repeats and a nearby β-propeller (Figure 7D). The disturbed fold of E6 in LRP2 p.C1401R may inhibit the formation of intramolecular interfaces between these domains and impair LRP2 from adopting its low-pH conformation required for releasing bound ligands and recycling.
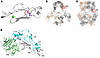 Figure 7
Structural modeling suggests that steric clashes would inhibit LRP2 p.C1401R recycling. (A) The sixth EGF-like domain (E6) is depicted in cartoon in gray, with the C1401-C1414 disulfide bridge shown, and the C1401R mutation indicated in magenta (PDB ID: 8EM4). A Ca2+ ion is represented as a green sphere. (B) The pH 7.5 LRP2 structure, with one protomer depicted in gray and the other in wheat. The position of E6 in one protomer is boxed in red. (C) The pH 5.2 LRP2 structure. The position of E6 in one protomer is boxed in red. (D) At pH 5.2 (PDB ID: 8EM7), E5 and E6 are depicted in gray, ligand-binding domains L8–L10 are in cyan, and the β-propeller P3 is in green. C1401R will likely disturb both the fold of E6 and its intramolecular interfaces.


