
Go to The Journal of Clinical Investigation
  • About
  • Editors
  • Consulting Editors
  • For authors
  • Journal stats
  • Publication ethics
  • Publication alerts by email
  • Transfers
  • Advertising
  • Job board
  • Contact
  • Physician-Scientist Development
  • Current issue
  • Past issues
  • By specialty
    • COVID-19
    • Cardiology
    • Immunology
    • Metabolism
    • Nephrology
    • Oncology
    • Pulmonology
    • All ...
  • Videos
  • Collections
    • In-Press Preview
    • Resource and Technical Advances
    • Clinical Research and Public Health
    • Research Letters
    • Editorials
    • Perspectives
    • Physician-Scientist Development
    • Reviews
    • Top read articles

  • Current issue
  • Past issues
  • Specialties
  • In-Press Preview
  • Resource and Technical Advances
  • Clinical Research and Public Health
  • Research Letters
  • Editorials
  • Perspectives
  • Physician-Scientist Development
  • Reviews
  • Top read articles
  • About
  • Editors
  • Consulting Editors
  • For authors
  • Journal stats
  • Publication ethics
  • Publication alerts by email
  • Transfers
  • Advertising
  • Job board
  • Contact
Top
  • View PDF
  • Download citation information
  • Send a comment
  • Terms of use
  • Standard abbreviations
  • Need help? Email the journal
  • Top
  • Abstract
  • Introduction
  • Results
  • Discussion
  • Methods
  • Manuscript information
  • Supplemental material
  • Footnotes
  • References
  • Version history
  • Article usage
  • Citations to this article
Advertisement

Research ArticleCell biologyDevelopmentVascular biology Open Access | 10.1172/jci.insight.208649

Esco2 restrains pathological endothelial-mesenchymal transition through hidden isoform regulation in a Roberts syndrome model

Roy Jung,1 Sherin Saheera,1 and Chinmay M. Trivedi1,2

1Division of Cardiovascular Medicine, Department of Medicine, and

2Department of Molecular, Cell, and Cancer Biology, University of Massachusetts Chan Medical School, Worcester, Massachusetts, USA.

Find articles by Jung, R. in: PubMed | Google Scholar

1Division of Cardiovascular Medicine, Department of Medicine, and

2Department of Molecular, Cell, and Cancer Biology, University of Massachusetts Chan Medical School, Worcester, Massachusetts, USA.

Find articles by Saheera, S. in: PubMed | Google Scholar

1Division of Cardiovascular Medicine, Department of Medicine, and

2Department of Molecular, Cell, and Cancer Biology, University of Massachusetts Chan Medical School, Worcester, Massachusetts, USA.

Find articles by Trivedi, C. in: PubMed | Google Scholar |

Published November 9, 2026 - More info

Published in Volume 11, Issue 21 on November 9, 2026
JCI Insight. 2026;11(21):e208649. https://doi.org/10.1172/jci.insight.208649.
© 2026 Jung et al. This work is licensed under the Creative Commons Attribution 4.0 International License. To view a copy of this license, visit http://creativecommons.org/licenses/by/4.0/.
Published November 9, 2026 - Version history
Received: April 30, 2026; Accepted: September 16, 2026
View PDF
Abstract

Roberts syndrome is caused by biallelic ESCO2 pathogenic variants, but the mechanisms linking ESCO2 loss to embryonic endothelial failure remain poorly defined. Endothelial cells must maintain identity and resist endothelial-mesenchymal transition (EndMT), yet conventional transcriptomics measures gene abundance rather than isoform composition. Here, using endothelial-specific Esco2 deletion in a mouse model relevant to Roberts syndrome, we show that Esco2 loss causes yolk sac vascular remodeling failure, pathological EndMT, diversion from hemogenic endothelial fate, hemogenic endothelial depletion, impaired hematopoietic output, and embryonic lethality. Short-read single-cell RNA-seq revealed broad endothelial reprogramming, whereas single-cell long-read isoform sequencing uncovered a hidden layer of isoform dysregulation that conventional gene-level analysis failed to resolve. Esco2-deficient endothelium exhibited transcriptome-wide isoform switching, disruption of a multi-tier splicing-factor network, and predicted broad loss or rewiring of protein-coding output. Chromatin occupancy profiling localized Esco2 to exonic regions near alternatively spliced loci, supporting a cotranscriptional route to spliceopathy. Whole-genome sequencing showed that local DNA variation was insufficient to explain these changes, supporting a predominantly posttranscriptional mechanism. These findings identify isoform control as a disease-relevant layer of endothelial identity maintenance in Roberts syndrome.

Introduction

Roberts syndrome is a rare autosomal recessive developmental disorder caused by biallelic pathogenic variants in ESCO2, which encodes a cohesin acetyltransferase required to establish sister chromatid cohesion during S phase (1–5). First described by John B. Roberts in 1919, the disorder is characterized by prenatal growth restriction, craniofacial anomalies, symmetric limb reduction defects, cardiac and renal anomalies, and frequent embryonic or perinatal mortality (1–3). Although skeletal and craniofacial phenotypes have dominated the clinical and experimental literature, vascular and fluid-balance abnormalities have also been reported, including hydrops fetalis, generalized edema, increased nuchal translucency, cystic hygroma, hemangioma, cerebrovascular abnormalities, and histologic evidence of vasculopathy (5–7). Together, these observations suggest that blood-vessel or lymphatic dysfunction may contribute to disease severity, yet the mechanisms linking ESCO2 deficiency to vascular pathology remain poorly defined.

ESCO2 encodes a conserved Eco1/Ctf7-family acetyltransferase that acetylates the cohesin subunit SMC3 to establish sister chromatid cohesion. Beyond chromosome segregation, cohesin regulates 3-dimensional genome architecture, transcription, DNA replication, and DNA repair, and pathogenic variants in cohesin-pathway genes cause a spectrum of developmental disorders collectively termed cohesinopathies (8, 9). Through loop extrusion (10) and CTCF-associated boundaries (11), cohesin also shapes enhancer-promoter communication and RNA polymerase II progression (12, 13), processes that can influence cotranscriptional splice-site recognition and exon definition. Current models of Roberts syndrome and related cohesinopathies have, therefore, emphasized defective cohesion, genome instability, and altered transcriptional regulation resulting from disrupted chromatin architecture (14). However, these mechanisms do not fully explain how loss of a single cohesin acetyltransferase produces diverse, tissue-specific developmental defects, including vascular and hematopoietic failure during embryogenesis.

Endothelial cells line the entire vascular system, yet their identity is not fixed. During embryonic development and adult disease, endothelial cells can undergo endothelial-mesenchymal transition (EndMT), a spectrum of states in which endothelial programs are progressively destabilized while mesenchymal properties emerge, contributing to vascular remodeling, fibrosis, and altered developmental fate decisions (15–17). In the embryonic yolk sac, where vascular remodeling and hematopoietic emergence occur in close spatial and developmental proximity, dysregulated EndMT could disrupt vascular patterning while diverting hemogenic endothelial fate and reducing hematopoietic output. Thus, defining how endothelial identity is maintained and how its destabilization alters developmental trajectories is central to understanding vascular failure in Roberts syndrome.

Current models of endothelial identity maintenance have centered largely on transcriptional control. Endothelial identity is reinforced by transcription factors such as ERG, SOX17, and KLF2/4 and by signaling pathways including BMP, Notch, and VEGF, whereas disruption of these circuits can promote EndMT and endothelial dysfunction (18–21). Although these studies have defined key transcriptional determinants of endothelial state, they have also reinforced a broader assumption: that cell identity is principally encoded at the level of total gene expression. Whether endothelial identity is also maintained through isoform-level regulation and cotranscriptional RNA processing remains less well understood.

Alternative splicing offers a compelling candidate mechanism for such regulation. By generating multiple transcript and protein isoforms from a single gene, splicing expands proteomic diversity and can stabilize cell-type–specific programs independently of changes in total transcript abundance (22, 23). In other developmental systems, dedicated splicing networks are required for maintenance of differentiated identity and suppression of alternative cell fates, including the MBNL/CELF axis in muscle, PTBP1-to-PTBP2 switching in the nervous system, and ESRP1/2-dependent control of epithelial identity (24–29). These precedents suggest that cell identity may be defined not only by which genes are expressed but also by which isoforms are produced. However, whether endothelial identity is similarly maintained by a dedicated splicing program, and whether failure of that program contributes to EndMT, has not been established.

A major barrier to answering this question has been technical. Standard short-read single-cell RNA-seq is typically analyzed at the gene level and has limited ability to resolve transcript isoforms, thereby missing changes in transcript composition that do not alter total expression. As a result, loss of a functional protein-coding isoform can remain invisible if it is offset by accumulation of alternative noncoding or structurally distinct transcripts. Recent advances in single-cell long-read sequencing, including single-cell isoform RNA-seq (ScISOr-seq), now make it possible to resolve isoform usage at single-cell resolution and to determine whether a previously hidden layer of cell-state regulation lies beneath conventional transcriptomic measurements (30–32).

Here, we use conditional Esco2 deletion in embryonic yolk sac endothelium as a Roberts syndrome model to define how Esco2 deficiency disrupts vascular development. Using short-read single-cell RNA-seq, single-cell isoform-resolved transcriptomics, lineage tracing, structural modeling, whole-genome sequencing, and Esco2 CUT&Tag, we identify a hidden spliceopathy, defined here as a transcriptome-wide disruption of alternative splicing and isoform selection, associated with pathological EndMT, diversion from hemogenic endothelial fate, reduced Lyve1-lineage hematopoietic cells in the fetal liver, and yolk sac vascular failure. These findings reveal isoform control as a previously unrecognized layer of endothelial-state regulation and suggest that concealed isoform-regulatory dysfunction may contribute to vascular pathology in Roberts syndrome and related developmental disorders.

Results

Endothelial Esco2 is required for yolk sac vascular remodeling and embryonic survival. To define the requirement for Esco2 in embryonic endothelium, we deleted Esco2 using Cdh5-CreERT2, with tamoxifen administration at E7.5 and E8.5 (Figure 1A). Esco2F/F;Cdh5-CreERT2 embryos were recovered at Mendelian ratios through E10.5 but were absent by E13.5 (0 of 21, P = 0.043), indicating that endothelial Esco2 deletion causes lethality between E10.5 and E13.5. By E10.5, mutant embryos showed blood pooling and, in a subset, edema, consistent with emerging circulatory failure (Figure 1B). Whole-mount Lyve1 staining revealed a profound defect in yolk sac vascular remodeling; control yolk sacs formed a branched hierarchy of large, intermediate, and fine vessels, whereas all examined mutant yolk sacs lacked organized vascular patterning and caliber hierarchy (Figure 1B).
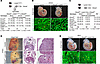
Endothelial deletion of Esco2 disrupts yolk sac vascular remodeling and cauFigure 1

Endothelial deletion of Esco2 disrupts yolk sac vascular remodeling and causes embryonic lethality. (A) Breeding and tamoxifen-induction strategy for endothelial Esco2 deletion. Esco2F/F females were crossed with Esco2F/+;Cdh5-CreERT2 males, and tamoxifen was administered at E7.5 and E8.5. Esco2F/F;Cdh5-CreERT2 embryos were recovered at Mendelian ratios at E9.5 (P = 0.69) and E10.5 (P = 0.95; mutants moribund), but not at E13.5 (0/21; P = 0.043; χ2 goodness-of-fit test). (B) Representative E10.5 embryos (top) and yolk sacs (bottom). Mutants show blood pooling (blue arrow), edema (white arrows), and loss of vascular patterning and caliber hierarchy, including large- (white arrows), medium- (red arrows), and small-diameter (yellow arrows) vessels. Loss of vascular patterning occurred in 3 of 3 mutants (100%) versus 0 of 3 controls (0%); blood pooling in 3 of 3 mutants (100%) versus 1 of 6 controls (17%); and edema in 1 of 3 mutants (33%) versus 0 of 6 controls (0%). Scale bars: 1,000 μm (top), 100 μm (bottom). (C) Breeding strategy and genotype distribution for Lyve1-Cre;Esco2 crosses. Esco2F/F;Lyve1-Cre pups were depleted at P0 (3 of 42, all born dead; P = 0.003; χ2 goodness-of-fit test). (D) Representative E16.5 mutants showing abnormal liver morphology (red arrow) and dilated sinusoids (black arrows). The liver phenotype occurred in 3 of 3 mutants (100%) versus 0 of 3 controls (0%) at E16.5 and in 3 of 3 mutants (100%) versus 0 of 3 controls (0%) at each of E12.5, E13.5, and E14.5. Scale bars: 1,000 μm (left), 500 μm (middle), 100 μm (right). H, heart; L, liver; T, thymus. (E) Representative E9.5 mutants appear grossly normal, but their yolk sacs lack vascular patterning and caliber hierarchy. The vascular phenotype occurred in 3 of 3 mutants (100%) versus 0 of 3 controls (0%). Scale bars: 1,000 μm (top), 500 μm (bottom).

Because Cdh5-CreERT2 targets the broader endothelial compartment, we next asked whether the phenotype could be reproduced by early deletion in yolk sac endothelium. We therefore used Lyve1-Cre, which recombines predominantly in yolk sac endothelium at E8.5–E9.5, before extending to liver sinusoidal endothelium by E10.5 and lymphatic endothelium at later stages (Figure 1C). Esco2F/F;Lyve1-Cre embryos were recovered at expected ratios during gestation but were significantly depleted at birth (3 of 42, all born dead; P = 0.003), showing that early Lyve1-lineage Esco2 deletion is sufficient to cause perinatal lethality (Figure 1C). By E16.5, mutants displayed abnormal liver morphology with dilated sinusoids (Figure 1D), whereas no overt lymphatic abnormalities were detected at later stages (data not shown). Although E9.5 mutant embryos appeared grossly normal, all examined mutant yolk sacs again failed to establish normal vascular hierarchy (Figure 1E). Thus, yolk sac vascular remodeling fails before overt abnormalities emerge in the embryo proper. Together, these findings localize the earliest and most penetrant defect to the yolk sac blood vasculature and identify Esco2 as an essential regulator of extraembryonic vascular remodeling and embryonic survival.

Loss of Esco2 reprograms yolk sac endothelium toward pathological EndMT. To determine how Esco2 loss reshapes the yolk sac vascular compartment, we performed short-read single-cell RNA-seq on E9.5 Esco2F/F;Lyve1-Cre yolk sacs and littermate controls, resolving 8,959 cells into 26 clusters (Figure 2A). Mutant yolk sacs showed a striking redistribution within the vascular compartment. Hemogenic endothelial cells were reduced approximately 2-fold (278 to 139 cells), whereas EndMT-associated states expanded, including EndMT_early (93 to 393 cells), EndMT_mid (177 to 308 cells), EndMT_late_1 (2 to 83 cells), and EndMT_late_2 (5 to 95 cells) (Figure 2B). Although total vascular cell numbers were similar between genotypes (~2,300 cells per condition), vascular compartment composition differed significantly (χ² = 527.7, P = 9.2 × 10−111), indicating redistribution of endothelial cell states rather than simple depletion of vascular cells (Figure 2C). Consistent with this interpretation, isoform-based deconvolution showed an approximately stable endothelial fraction together with an approximately 3-fold expansion of the EndMT/smooth muscle–like fraction in mutant yolk sacs (Supplemental Figure 1; supplemental material available online with this article; https://doi.org/10.1172/jci.insight.208649DS1).
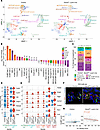
Esco2 loss remodels the yolk sac vascular compartment and promotes pathologFigure 2

Esco2 loss remodels the yolk sac vascular compartment and promotes pathological EndMT. (A) UMAP of 8,959 E9.5 yolk sac cells from control and Esco2F/F;Lyve1-Cre samples annotated into 26 clusters using established markers. (B) Cluster-abundance log2 fold changes. EndMT_late_1 expanded 41.5-fold, whereas Hemogenic EC decreased to 0.50-fold. EndMT_late_1 expressed Fbn1, Col3a1, and Mecom with weak residual Efnb2 and Vwf; EndMT_late_2 expressed Col3a1 with minimal other lineage markers. (C) Vascular compartment composition by genotype (χ² = 527.7, P = 9.2 × 10–¹¹¹; χ2 test of homogeneity). (D) Endothelial gene expression in YS Plexus EC and Hemogenic EC. In Hemogenic EC, Ramp2, Id3, Lyve1, and Gng11 were significantly reduced; in YS Plexus EC, only Id3 reached transcriptome-wide adjusted significance. Cdh5, Emcn, and Klf2 were unchanged. Endothelial identity module scores did not differ significantly between genotypes (2-sided Wilcoxon rank-sum test with Bonferroni correction). (E) Mesenchymal gene expression across YS Plexus EC, Hemogenic EC, EndMT_early, EndMT_mid, EndMT_late_1, and EndMT_late_2. Acta2, Tagln, Col1a1, Col3a1, Fbn1, Lum, and Twist2 showed progressively increased expression across the EndMT-associated continuum. (F) Immunofluorescence of E9.5 yolk sacs for Lyve1 (green), SMA (red), GFP (gray), and Hoechst (blue). Mutants showed increased SMA staining (red arrows). GFP marks Lyve1-Cre–recombined cells and descendants. Images are representative of 3 independent yolk sacs per genotype. Scale bar: 10 μm. (G) Endothelial identity versus EndMT module scores in individual YS Plexus EC and Hemogenic EC cells. Control cells showed a weak positive correlation (ρ = 0.124, P = 0.019), whereas Esco2F/F;Lyve1-Cre cells showed a negative correlation (ρ = −0.273, P = 5.1 × 10⁻⁶; 2-sided Spearman correlation).

This redistribution was characterized by selective reduction of endothelial regulators together with strong induction of an EndMT-associated program. In Hemogenic EC, Ramp2, Id3, Lyve1, and Gng11 were significantly reduced in mutant yolk sacs, whereas in YS Plexus EC only Id3 reached transcriptome-wide adjusted significance (Figure 2D). Cdh5, Emcn, and Klf2 were unchanged in both populations, and overall endothelial identity module scores did not differ significantly between genotypes. In contrast, mesenchymal genes — including Acta2, Tagln, Col1a1, Col3a1, Fbn1, Lum, and Twist2 — increased across the endothelial-mesenchymal continuum, with the strongest expression in the expanded mutant EndMT populations (Figure 2E). Independent rescoring of the identical 13-gene EndMT signature using UCell yielded highly concordant per-cell scores with AddModuleScore (Spearman ρ = 0.936; Pearson r = 0.962; n = 7,359 cells), demonstrating that the observed program was robust to the scoring method. Thus, Esco2 loss promotes acquisition of a mesenchymal and extracellular matrix program alongside selective attenuation of endothelial regulators, rather than uniform loss of endothelial gene expression.

Immunofluorescence confirmed increased smooth muscle actin in Esco2F/F;Lyve1-Cre yolk sacs, including within GFP+ Lyve1-lineage cells, providing protein-level support for acquisition of mesenchymal features within the targeted lineage (Figure 2F). Finally, endothelial identity and EndMT scores showed a weak positive correlation in control cells (ρ = 0.124, P = 0.019) but became negatively correlated in mutant endothelial populations (ρ = –0.273, P = 5.1 × 10⁻⁶; Figure 2G). This reversal indicates that EndMT-program activation becomes increasingly coupled to attenuation of endothelial features following Esco2 loss.

Pathological EndMT diverts hemogenic endothelial fate after Esco2 loss. To define how endothelial state transitions unfold after Esco2 deletion, we projected 3 complementary programs across the yolk sac vascular compartment: endothelial identity, EndMT, and erythro-myeloid progenitor (EMP) fate potential (Figure 3A). Endothelial identity scores were highest in YS Plexus EC in both genotypes, whereas mutant cells showed broader EndMT activation across the expanded transitional populations. EMP fate potential was also redistributed, consistent with altered hemogenic endothelial differentiation after Esco2 loss (Figure 3A). A smoothed single-cell heatmap of 37 genes across the 9-stage continuum resolved a graded molecular transition from endothelial through mixed endothelial-mesenchymal to late mesenchymal states (Figure 3B).
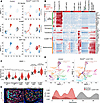
An EndMT continuum redirects Lyve1-lineage hemogenic endothelial fate towarFigure 3

An EndMT continuum redirects Lyve1-lineage hemogenic endothelial fate toward a pathological trajectory. (A) Feature plots showing endothelial identity, endothelial-mesenchymal transition (EndMT), and erythro-myeloid progenitor (EMP) fate scores on the uniform manifold approximation and projection, split by genotype. (B) Smoothed single-cell heatmap of 37 genes across a 9-stage endothelial-mesenchymal continuum. (C) EndMT module scores across the 6-stage core continuum. Esco2F/F;Lyve1-Cre cells showed significantly higher scores at all stages with sufficient cells for formal comparison (P < 1 × 10⁻²³, 2-sided Wilcoxon rank-sum test). EndMT_late_1 and EndMT_late_2 were not formally tested because of insufficient control cells. Violin plots show distributions with median and interquartile range. (D) Top, Slingshot trajectories inferred independently for each genotype. Five lineages were shared between control and Esco2F/F;Lyve1-Cre cells, whereas mutant cells displayed an additional branch terminating in a mixed smooth muscle/endothelial/hematopoietic state. Bottom, pseudotime density distributions derived independently for each genotype (KS D = 0.746, P = 5.5 × 10–237, 2-sample Kolmogorov-Smirnov test). Dashed lines indicate median pseudotime. (E) Immunofluorescence of E11.5 fetal liver from control and Esco2F/F;Lyve1-Cre embryos. GFP (red) marks Lyve1-Cre lineage-traced cells, including yolk sac-derived hematopoietic cells; Lyve1 (green) marks sinusoidal endothelial cells; Hoechst (blue) marks nuclei. Mutant livers show reduced GFP+ hematopoietic cells despite preserved Lyve1+ sinusoidal endothelium, consistent with impaired yolk sac hemogenic output. Images are representative of 3 independent embryos per genotype. Scale bar: 100 μm.

EndMT scores increased progressively from YS Plexus EC through late EndMT states and were significantly elevated at every stage with sufficient cells for formal comparison in mutant yolk sacs (Figure 3C). The most advanced states, EndMT_late_1 and EndMT_late_2, were nearly absent from controls but expanded after Esco2 loss. These findings indicate that Esco2 deficiency expands and advances cells along a pathological endothelial-mesenchymal continuum rather than simply altering the abundance of preexisting endothelial populations.

To determine how this state transition affects lineage progression, we inferred trajectories independently for each genotype. Five major vascular lineages were shared between conditions, whereas mutant yolk sacs acquired an additional lineage extending from YS Plexus EC through EndMT_late_2 to a mixed smooth muscle/endothelial/hematopoietic state. This altered topology was accompanied by a difference in genotype-specific pseudotime distributions (KS D = 0.746, P = 5.5 × 10–²³7; Figure 3D).

We next examined whether depletion of hemogenic endothelium in the yolk sac was associated with impaired downstream hematopoietic output. In E11.5 Lyve1-Cre;ROSAmT/mG lineage-traced embryos, GFP+ Lyve1-lineage hematopoietic cells were abundant throughout control fetal livers. By contrast, Esco2F/F;Lyve1-Cre fetal livers contained fewer GFP+ hematopoietic cells despite preservation of Lyve1+ sinusoidal endothelium (Figure 3E). Thus, the reduction in yolk sac hemogenic endothelium is accompanied by diminished contribution of Lyve1-lineage hematopoietic cells to the fetal liver.

Together, these findings show that Esco2 loss expands a pathological EndMT continuum, redirects endothelial progression toward an aberrant mixed-lineage endpoint, and compromises hemogenic endothelial output to the developing fetal liver.

Single-cell isoform analysis reveals a hidden spliceopathy associated with pathological EndMT. To determine whether the EndMT program revealed by short-read single-cell RNA-seq also involved altered transcript usage, we performed ScISOr-seq on the same complementary DNA libraries using Oxford Nanopore long-read sequencing. Isoform-level clustering of 9,067 cells identified 27 transcript-defined states that were only partially concordant with gene-level clusters (adjusted Rand index = 0.339), revealing cell-state organization not captured by gene-level clustering alone (Figure 4A). Notably, the transcript-defined EndMT (spliceopathy) population expanded approximately 22-fold in mutant yolk sacs, from 21 to 462 cells (Figure 4A).
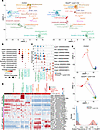
Single-cell isoform sequencing reveals EndMT-associated transcript remodeliFigure 4

Single-cell isoform sequencing reveals EndMT-associated transcript remodeling not resolved by gene-level analysis. (A) Isoform-level uniform manifold approximation and projection (UMAP) of 9,067 long-read single cells split by genotype (control, n = 4,191; Esco2F/F;Lyve1-Cre, n = 4,876). Twenty-seven isoform-defined clusters were annotated using marker isoforms and yolk sac cell-type signatures. The EndMT(spliceopathy) cluster expanded 22-fold in mutants (21–462 cells). (B) Dot plot of subtype-defining isoforms across 4 endothelial cell populations. Arterial/Hemogenic EC were characterized by Gja5 and Gja4, whereas Hemogenic EC(Hox+) was characterized by Hoxa9 and Hoxa7. (C) Stacked violin plots showing reduced usage of endothelial-associated isoforms (top) and increased usage of mesenchymal-associated isoforms (bottom) across 7 clusters spanning the endothelial-to-EndMT continuum (blue, control; red, mutant). Usage of Lyve1, Flt1, and 2 Stab2 isoforms decreased, whereas usage of Zeb1, Col1a2, Fbn2, and Acta2 isoforms increased in mutant cells. (D) Smoothed single-cell heatmap of 24 isoforms across the endothelial-to-EndMT continuum (2,367 cells, 7 clusters), grouped as endothelial associated, oppositely switched, or EndMT associated. Opposing isoform behavior was observed for Stab2, Col4a1, Meg3, and Acvrl1/ALK1. (E) Isoform-level trajectories inferred independently for control (799 cells) and mutant (1,568 cells) populations using YS Plexus EC as the starting state. Control trajectories passed through Hemogenic EC (Hox+), whereas mutant trajectories proceeded directly toward EndMT states. Bottom, scaled pseudotime distributions (control median, 0.058; mutant median, 0.778; KS D = 0.447, P = 2.85 × 10−49; 2-sample Kolmogorov-Smirnov test). Values in B–D represent normalized transcript-level expression. Isoform identifiers omit the “ENSMUST” prefix; for example, Stab2 (00000218366) denotes ENSMUST00000218366. Full identifiers are provided in Supplemental Table 2.

Isoform-level analysis further resolved 4 endothelial populations and revealed transcript diversity within canonical endothelial markers. Stab2 expressed 5 cluster-specific isoforms in YS Plexus EC, the greatest isoform diversity among the endothelial markers examined (Figure 4B). Across the endothelial-to-EndMT continuum, mutant cells showed reduced usage of endothelial-associated isoforms, including those of Stab2, Flt1, and Lyve1, together with increased usage of mesenchymal-associated isoforms, including Zeb1 and Col1a2 (Figure 4C). Two adjacent Stab2 isoforms responded differently to Esco2 loss, demonstrating isoform-selective regulation that was not resolved by gene-level quantification.

A smoothed single-cell heatmap across the endothelial-to-EndMT continuum identified additional genes with opposing isoform behavior, including Stab2, Col4a1, Meg3, and Acvrl1/ALK1, further demonstrating extensive isoform remodeling during the transition (Figure 4D). To determine how this isoform layer relates to altered cell-state progression, we inferred trajectories independently for each genotype. In control yolk sacs, EndMT-associated trajectories passed through Hemogenic EC (Hox+), whereas mutant trajectories proceeded directly from YS Plexus EC toward EndMT states, producing a shift toward late pseudotime (KS D = 0.447, P = 2.85 × 10−49; Figure 4E). Together, these data uncover a hidden isoform-regulatory layer that accompanies pathological EndMT and resolves genotype-dependent endothelial state transitions not apparent from gene-level analysis alone.

A hidden spliceopathy reshapes endothelial protein output through widespread loss and rewiring. We next asked whether the isoform disruption uncovered by long-read sequencing was visible at the level of total gene expression. Cross-referencing isoform switches with gene-level changes showed that 77.7% of altered loci (1,419 of 1,827 genes) fell into a hidden layer in which overall transcript abundance remained largely unchanged despite major shifts in isoform usage (Figure 5A). This concealed spliceopathy was observed across all 4 endothelial populations (Figure 5B) and included regulators relevant to endothelial identity and EndMT, including Dab2, Col4a1, Cald1, Jarid2, and Fn1, whose transcript composition changed without gene-level expression change (Figure 5C). Functional classification of the isoform-switch consequences showed that most events (82.2%) involved protein-coding transcripts, with smaller fractions classified as retained intron (6.5%), coding sequence not defined (4.4%), nonsense-mediated decay target (3.3%), long noncoding RNA or processed transcript (2.5%), and other noncoding transcripts (1.1%) (Figure 5D). Thus, the spliceopathy predominantly alters protein-coding potential rather than noncoding RNA output and is largely missed by conventional gene-level analysis.
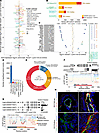
Hidden isoform switching predicts widespread protein loss in Esco2-deficienFigure 5

Hidden isoform switching predicts widespread protein loss in Esco2-deficient endothelial cells. (A) Scatter plot of 1,827 genes comparing gene-level fold change with maximum single-isoform log2 fold change, defined as the largest absolute log2 fold change of any isoform. Most altered genes (77.7%) were detected only at the isoform level. (B) Distribution of hidden isoform changes across 4 endothelial clusters. (C) Top 20 isoform-switched genes across endothelial clusters. (D) Functional classification of isoform-switch events. (E) Predicted protein fate among 1,827 altered genes: lost, 60.6% (1,107 genes); gained, 26.4% (482 genes); rewired, 10.6% (193 genes); noncoding, 2.5% (45 genes). (F) Dab2 switchPlot and AlphaFold3 pLDDT analysis showing predicted phosphotyrosine-binding domain replacement (dIF = −0.699, q = 4.0 × 10–²4). (G) Cald1 switchPlot and AlphaFold3 pLDDT comparison. The control-enriched l-CaD isoform (534 aa) was lost, whereas h-CaD (768 aa) was gained in Esco2-deficient endothelial cells (dIF = −0.214 and +0.076; q = 5.0 × 10–³9 and 2.2 × 10–¹²). The switch introduces a 234 aa central repeat domain. switchPlots used endothelial cell–only pseudobulk data. (H) COL4A1 immunofluorescence in control and Esco2F/F;Lyve1-Cre tissues. Top, E9.5 yolk sacs stained for Lyve1 (green), COL4A1 (red), GFP (gray), and Hoechst (blue); bottom, E9.5 embryo proper stained for GFP (green), COL4A1 (red), and Hoechst (blue). COL4A1 protein expression increased in GFP+ Lyve1-lineage cells in mutant yolk sacs and embryos. Images are representative of 3 control and 4 mutant biological replicates; quantification is shown in Supplemental Figure 2. Scale bars: 10 μm. For F and G, isoform fraction (IF) is individual transcript expression divided by summed expression of all detected transcripts from the same gene; dIF = IFmutant − IFcontrol. Full transcript identifiers are provided in Supplemental Table 3.

We therefore examined how these hidden isoform switches were predicted to affect protein output. Protein-fate analysis classified 97.5% of the 1,827 altered genes and identified predicted loss of protein-coding output as the dominant consequence (Figure 5E). In 60.6% of genes (1,107 loci), the principal protein-coding isoform was predicted to be replaced by noncoding transcripts. By contrast, 26.4% of genes (482 loci) were predicted to gain protein-coding output from an alternative isoform, whereas 10.6% (193 loci) retained protein-coding potential but were predicted to encode proteins with altered length or domain architecture. Only 2.5% (45 loci) represented switches between noncoding isoforms.

To assess the structural consequences of representative switches, we modeled isoform pairs using AlphaFold3 (33). In Dab2, isoform switching was predicted to alter phosphotyrosine-binding domain–containing adaptor architecture (Figure 5F). In Cald1, Esco2 loss shifted isoform usage from low-molecular-weight caldesmon (l-CaD) toward high-molecular-weight caldesmon (h-CaD), introducing a 234 aa central repeat domain associated with smooth muscle and mesenchymal differentiation (Figure 5G).

We next examined whether this isoform-level remodeling was accompanied by protein-level extracellular matrix changes in vivo. GFP+ Lyve1-lineage cells showed increased COL4A1 protein expression in both the Esco2-deficient yolk sac and embryo proper (Figure 5H). COL4A1 increased 2.36-fold in the yolk sac (P = 0.018) and 14.3-fold in the embryo proper (P = 0.0029; Supplemental Figure 2), demonstrating robust extracellular matrix remodeling within the targeted Lyve1 lineage. Together, these findings show that the hidden spliceopathy is predicted to broadly alter endothelial protein-coding output and is accompanied by lineage-resolved protein-level remodeling in vivo.

Loss of Esco2 disrupts a multi-tier splicing-factor network linked to cotranscriptional exon definition. Because Esco2 has established roles in genome maintenance and DNA repair, we asked whether the spliceopathy in Esco2-deficient yolk sac endothelium might reflect secondary DNA lesions at the affected loci. We therefore performed whole-genome sequencing on pooled, FACS-sorted GFP+ E9.5 yolk sac cells from Lyve1-Cre;ROSAmT/mG control and Esco2F/F;Lyve1-Cre;ROSAmT/mG mutant embryos, in which Lyve1-Cre–mediated recombination marks targeted cells by GFP expression. Variants were broadly distributed across chromosomes without focal enrichment (Figure 6A). Among the 1,827 isoform-switched genes, most (76.4%) contained no detectable variants (Figure 6B), and progressive filtering identified only 2 splice-proximal variants and 4 predicted damaging coding variants (Figure 6C). None affected the major splicing factors, principal EndMT-associated genes, or representative structurally remodeled genes highlighted in this study. Thus, local single-nucleotide and short insertion/deletion variation is insufficient to explain the scale and organization of the endothelial spliceopathy.
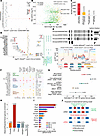
Genomic and network analyses support a multi-tier splicing-factor cascade dFigure 6

Genomic and network analyses support a multi-tier splicing-factor cascade downstream of Esco2 loss. (A) Chromosome-level single-nucleotide variant distribution showed a broadly uniform mutant-to-control ratio of approximately 1.50. (B) Of 1,827 isoform-switched genes, 76.4% contained no detectable variants. (C) Stepwise filtering identified mutant-specific variants in 432 genes, including 2 splice-proximal and 4 predicted damaging coding variants. (D) Sixteen of 32 splicing factors underwent isoform switching, and 15 of 16 showed little or no gene-level expression change. (E) Hnrnpm switched toward a 690-aa isoform containing a 50 aa insertion between RRM3 and the M-domain (dIF = 0.546; adjusted P = 3.9 × 10–²8); AlphaFold3 modeling predicted increased ordering of the intervening linker. (F) Matrix organizing the 16 altered splicing factors by regulatory tier, predicted domain impact, switch severity, and endothelial-cluster breadth. (G) Estimated regulatory breadth of the disrupted splicing-factor network based on published genome-wide studies. (H) Esco2 CUT&Tag enrichment across genomic features in FACS-sorted GFP+ E9.5 Lyve1-lineage yolk sac cells. Peaks were enriched at exons (observed/expected [O/E] = 5.0), depleted at pericentromeric regions (O/E = 0.37), and not enriched at promoters (O/E = 1.04); dashed line indicates O/E = 1. (I) Esco2 peaks overlapping alternatively spliced exons within the 16 isoform-switched splicing-factor genes; Prpf8, Ptbp3, and U2af2 showed the greatest overlap. (J) Proposed model of Esco2-associated exon definition and propagation of isoform dysregulation after Esco2 loss. For E, dIF = IFmutant − IFcontrol; IF is individual transcript expression divided by summed expression of all detected transcripts from that gene. Transcript identifiers are abbreviated as in Figure 4; full identifiers are provided in Supplemental Table 3.

We next asked whether the hidden spliceopathy reflected disruption of the splicing machinery itself. Of 32 splicing factors examined, 16 underwent significant isoform switching within endothelial populations, and 15 of 16 resided in the hidden layer, with little or no corresponding change in total gene expression (Figure 6D). None of the 16 altered splicing factors carried a predicted damaging coding variant, consistent with an isoform-regulatory rather than locally mutational mechanism. To assess the structural consequences of splicing-factor disruption, we focused on Hnrnpm, which underwent a reciprocal protein-coding isoform switch to a 690 aa isoform containing a 50-aa insertion between RRM3 and the M-domain. AlphaFold3 analysis predicted increased ordering of the intervening linker region, consistent with a rigidified linker and altered RNA-binding geometry (Figure 6E).

Extending this analysis to the full set of altered splicing factors, we organized the 16 isoform-switched factors by established splicing biology, domain impact, severity, and endothelial-cluster breadth (Figure 6F). This analysis revealed a 4-tier hierarchy spanning core spliceosome components, primary regulators, secondary regulators, and downstream effectors. Several factors, including Srsf6, Sf3b1, Hnrnpm, Mbnl2, Hnrnpa2b1, and Hnrnpu, were altered across all 4 endothelial populations, indicating broad propagation of splicing-factor disruption throughout the endothelial compartment. Collectively, these factors span core spliceosomal machinery and several classes of alternative-splicing regulators with broad and partially overlapping transcriptome-wide regulatory scopes (Figure 6G), supporting a model in which Esco2 loss destabilizes a hierarchical splicing-regulatory network that amplifies transcriptome-wide isoform dysfunction.

To explore how Esco2 might interface with RNA processing, we performed Esco2 cleavage under targets and tagmentation (CUT&Tag) in FACS-sorted GFP+ E9.5 Lyve1-lineage yolk sac cells. Esco2 occupancy was enriched approximately 5-fold at exons, depleted at pericentromeric regions, and not enriched at promoters (Figure 6H), indicating preferential association with exonic gene-body chromatin rather than promoter-proximal regions. Within the 16 isoform-switched splicing-factor genes, Esco2 peaks overlapped alternatively spliced exons, with the greatest numbers of overlapping peaks at Prpf8, Ptbp3, and U2af2 (Figure 6I). Known-motif analysis showed no enrichment of the canonical CTCF motif among exon-overlapping Esco2 peaks (HOMER P = 1.0; detected in 0% of peaks; data not shown).

Among the disrupted splicing factors, SF3B1 and U2AF2 were selected for functional testing because they represent complementary components of early spliceosome function, with U2AF2 contributing to 3′ splice-site recognition and SF3B1 to branch-point recognition and U2 snRNP-dependent spliceosome assembly (Figure 6F); both showed Esco2 peak overlap at alternatively spliced exons (Figure 6I). To determine whether impaired splicing-factor function is sufficient to reproduce key features of endothelial reprogramming, we independently depleted SF3B1 or U2AF2 in human umbilical vein endothelial cells. Depletion of either factor reduced CD31 by approximately 50% (Dunnett-adjusted P = 0.019 for SF3B1 and P = 0.020 for U2AF2) and increased COL4A1 approximately 13-fold after SF3B1 depletion and 14-fold after U2AF2 depletion (adjusted P = 0.0016 and P = 0.00077, respectively; n = 3 independent biological replicates per condition; Supplemental Figure 3, A–C). Consistent with these findings, a separate set of experiments showed that VE-cadherin/CDH5 was reduced by approximately 85% after depletion of either factor (adjusted P = 1.8 × 10⁻⁴ and P = 2.5 × 10⁻⁴ for SF3B1 and U2AF2, respectively), whereas α-SMA increased approximately 12-fold and 11-fold, respectively (adjusted P = 2.3 × 10⁻⁵ and P = 5.2 × 10⁻⁵; n = 4 independent biological replicates per condition; Supplemental Figure 3, D–F). Together, the concordant reduction of endothelial markers and increase of mesenchymal-associated markers demonstrates that disruption of distinct splicing factors is sufficient to induce key features of endothelial reprogramming independently of Esco2 deficiency and embryonic developmental context.

To determine whether the Esco2 occupancy pattern was associated with broad changes in cohesin acetylation, we quantified acetylated SMC3 relative to total SMC3 in GFP+ yolk sac endothelium. The ratio was unchanged in Esco2-deficient cells (P = 0.44; Supplemental Figure 4), arguing against broad loss of detectable cohesin acetylation.

Together, these findings support a model in which Esco2 associates with regulated exonic chromatin and contributes to cotranscriptional exon definition. Loss of this regulatory layer may alter exon usage in splicing-factor genes, thereby propagating isoform dysregulation across downstream endothelial targets and promoting pathological EndMT (Figure 6J).
Discussion

A hidden endothelial spliceopathy expands the vascular mechanism of Roberts syndrome. Our findings provide a mechanistic framework for an underexplored vascular component of Roberts syndrome. Although Roberts syndrome has been defined primarily by limb, craniofacial, cardiac, renal, and growth phenotypes, clinical reports of hydrops fetalis, generalized edema, cystic hygroma, hemangioma, cerebrovascular abnormalities, and tissue vasculopathy suggest that blood vascular or lymphatic dysfunction may contribute to disease severity. The etiologic basis for these manifestations has remained unclear. We show that loss of Esco2 in yolk sac endothelium triggers pathological EndMT, diversion from hemogenic endothelial fate, reduction of Lyve1-lineage hematopoietic cells in the fetal liver, and failure of vascular remodeling. The observed abnormalities extend to the embryo proper and fetal liver, whereas organ-specific vascular effects in the heart and lung remain to be defined. Mechanistically, this phenotype is linked to a hidden isoform-level spliceopathy involving widespread predicted remodeling of endothelial protein-coding output and disruption of a multi-tier splicing-factor network, rather than local DNA variation at affected loci. These data extend models of Roberts syndrome pathogenesis that have centered on cohesion defects, genome instability, and gene-level transcriptional dysregulation, and they suggest that concealed isoform-regulatory failure may contribute to tissue-specific developmental abnormalities in ESCO2-related disease. More broadly, these data support the use of isoform-resolved approaches to interrogate developmental disorders whose phenotypic severity is not fully explained by conventional transcriptomic analysis.

Isoform resolution reveals a concealed disease layer. A major conceptual advance of this work is the demonstration that gene-level expression fails to capture much of the molecular pathology caused by Esco2 loss. Indeed, 77.7% of the 1,827 isoform-switched genes in mutant endothelium showed little or no change in total transcript abundance, yet many were predicted to lose dominant protein-coding output or generate altered protein products. Thus, the endothelial transcriptome can appear relatively preserved at the gene level while being extensively remodeled at the isoform level. This hidden layer has implications well beyond Esco2. Transcriptomic studies of cohesinopathies and related developmental disorders have largely relied on conventional gene-level analyses of short-read data, potentially obscuring biologically important isoform-level abnormalities (22, 23, 30–32, 34). Our findings therefore argue that isoform-resolved approaches, particularly at single-cell resolution, are not merely additive but can be necessary for understanding disease states in which chromatin regulation, transcriptional kinetics, and RNA processing intersect. Because sparse detection reduces power to identify low-abundance transcripts, the 1,827 genes meeting our isoform-switch criteria likely represent an underestimate of the extent of isoform remodeling; absolute transcript-level fold changes, however, remain sensitive to differential detection and should be interpreted cautiously.

A splicing-factor cascade amplifies endothelial dysfunction. The spliceopathy we identify is notable not only for its scale but also for its architecture. Sixteen splicing factors were themselves isoform-switched across endothelial populations, spanning core spliceosome components, SR proteins (35–37), hnRNPs (38, 39), MBNL family members (24, 40), and downstream regulators (41). This organization is consistent with a hierarchical cascade in which defects in splice-site recognition and alternative-splicing regulation propagate through the broader network (42, 43). The representative lesions are mechanistically informative. Srsf6 undergoes near-complete loss of its full-length isoform and replacement by a truncated product that retains the RNA-recognition motif but lacks the RS domain required for spliceosome recruitment, potentially conferring dominant-negative activity (35–37). Hnrnpm, by contrast, undergoes a coding isoform switch that introduces a 50-aa insertion and is predicted to increase ordering of a normally flexible linker, consistent with altered RNA-binding geometry (38, 39). Prior studies in epithelial systems have established that splicing regulators can actively govern epithelial-mesenchymal plasticity; ESRP1 expression or RBFOX2 depletion shifted mesenchymal cells toward epithelial morphology and motility, whereas hnRNPM promoted EMT-associated alternative splicing and metastatic behavior (44, 45). Disruption of this network was functionally supported by depletion of either SF3B1 or U2AF2 in human endothelial cells, which reduced CD31 and CDH5 and increased COL4A1 and SMA, reproducing key features of endothelial destabilization and extracellular-matrix remodeling. Because these perturbations were performed without ESCO2 deficiency, they support a broader relationship between splicing-factor dysfunction and endothelial plasticity beyond the Roberts syndrome model. These perturbations establish sufficiency for key molecular features of endothelial reprogramming but not reversibility; a definitive rescue will require restoration of the relevant isoform or splicing-factor function in Esco2-deficient endothelium. Downstream, endothelial effectors including Dab2 (46, 47) and Cald1 (48) undergo isoform switches predicted to alter protein architecture, whereas Col4a1 (49) shows opposing isoform behavior accompanied by increased COL4A1 protein expression in Esco2-deficient Lyve1-lineage cells. Together, these findings support a model in which Esco2 loss destabilizes splicing control at multiple levels, converting an upstream regulatory lesion into widespread predicted changes in protein-coding output that favor pathological EndMT.

Exonic Esco2 occupancy suggests a cotranscriptional route to spliceopathy. A key question raised by our findings is how loss of a cohesin acetyltransferase produces widespread isoform-regulatory consequences. Our Esco2 CUT&Tag analysis provides a candidate mechanistic link. In GFP+ Lyve1-lineage yolk sac cells, Esco2 occupancy was enriched approximately 5-fold at exons, but not at promoters, and was depleted at pericentromeric regions. This distribution indicates that the predominant Esco2 occupancy detected in this context is associated with exonic gene-body chromatin rather than canonical promoter-proximal regulation. Within the 16 isoform-switched splicing-factor loci, Esco2 peaks overlapped alternatively spliced exons, with the greatest numbers of overlapping peaks at Prpf8, Ptbp3, and U2af2. The absence of canonical CTCF motif enrichment, together with the preserved acetylated SMC3/total SMC3 ratio in mutant endothelium, argues against a simple model based on preferential localization to canonical CTCF sites or broad loss of detectable cohesin acetylation, although locus-specific dependence on cohesin remains possible. Cohesin has also been shown to regulate alternative splicing through interactions with splicing factors, providing precedent for a direct link between cohesin function and RNA processing (50). Whether this activity is related to the exonic Esco2 occupancy observed here remains unknown. Together, these occupancy features support a model in which Esco2 may contribute to exon definition or splice-site recognition at vulnerable alternatively spliced regions. Because many splicing-factor genes are, themselves, extensively alternatively spliced, disruption of this exonic regulatory layer could preferentially destabilize the splicing machinery and initiate the feed-forward cascade observed here. Future studies combining higher-resolution Esco2 occupancy mapping with RNA polymerase II dynamics and exon-associated chromatin profiling will be needed to test this model directly.

Isoform-regulatory failure links Esco2 loss to vascular and hematopoietic dysfunction. At the developmental level, our data connect endothelial RNA-processing failure to 2 coordinated outcomes: expansion of pathological EndMT across multiple yolk sac endothelial states and diversion from hemogenic endothelial fate (15, 17, 51–54). This dual effect is especially important because it helps explain how a single genetic lesion can simultaneously disrupt vascular remodeling and compromise extraembryonic hematopoietic output. In this framework, Esco2 is not solely a genome-maintenance factor in endothelium but also contributes to the stability of endothelial state and appropriate developmental progression during yolk sac maturation. The broader implication is that isoform regulation and cotranscriptional RNA processing may be major determinants of endothelial plasticity during development. More generally, our findings suggest that developmental failure in cohesinopathies may arise not only from altered chromatin organization or gene-level transcriptional output, but also from hidden isoform-level defects that reshape cell-fate decisions. Defining how Esco2 interfaces with cotranscriptional splicing and RNA-processing machinery will, therefore, be an important next step, but the present data identify isoform disruption as a major pathogenic layer linking Esco2 dysfunction to vascular remodeling failure, impaired hematopoietic output, and embryonic disease.

Methods

Sex as a biological variable. Male and female embryos and pups were expected in all mouse crosses according to Mendelian inheritance. Embryonic sex was not determined for E9.5, E10.5, E13.5, or E16.5 samples because the study focused on genotype-dependent effects during embryonic vascular development, before overt sex-specific differences in yolk sac endothelial remodeling are expected. P0 pups were included in survival analyses regardless of sex. No embryos or pups were excluded on the basis of sex. Because sex was not assigned for embryonic samples, the study was not powered to evaluate sex-specific effects.

Mouse lines and breeding. The Esco2fl, Lyve1-Cre, Cdh5-CreERT2, and ROSAmT/mG mouse lines have been described previously (55–58). All mice were maintained on a mixed genetic background, and littermates were used as controls for all experiments. For inducible endothelial deletion, Esco2F/F mice were crossed with Cdh5-CreERT2 mice. Pregnant dams received tamoxifen by oral gavage at E7.5 and E8.5 at a dose of 75 mg/kg body weight (75 μg/g body weight). Embryos from these crosses were collected at E9.5, E10.5, and E13.5. For Lyve1-lineage deletion, Esco2fl mice were crossed with Lyve1-Cre mice, and embryos or pups were analyzed at E9.5, E13.5, E16.5, and P0.

Short-read single-cell RNA-seq. Single-cell transcriptomes were generated using the Chromium Next GEM Single Cell 3′ kit v3.1 (10x Genomics) according to the manufacturer’s instructions. Single E9.5 yolk sacs from mutant and control littermates were collected from the same litter and dissociated into single-cell suspensions. Cells were loaded onto the Chromium Controller with a target recovery of 10,000 cells per sample. cDNA and final library quality were assessed using a NanoDrop spectrophotometer and an Agilent 5300 Fragment Analyzer High Sensitivity DNA assay. Libraries were sequenced on an Illumina HiSeq 4000 at UMass Chan Medical School. Reads were aligned to the GRCm39 mouse reference genome using Cell Ranger (59) with GENCODE vM35 annotations. Cells with 500–5,000 detected genes and less than 10% mitochondrial reads were retained, yielding 8,959 cells for downstream analysis in Seurat v5 (60). Data were log-normalized, and 2,000 variable features were identified and used for scaling and principal component analysis. Samples were integrated by reciprocal principal component analysis, and the first 20 components were used for UMAP, shared-nearest-neighbor graph construction, and clustering. Resolution 1.8 yielded 26 clusters. Cluster identities were assigned before trajectory analysis using positively enriched markers identified by FindAllMarkers (min.pct = 0.25; logfc.threshold = 0.25) and established yolk sac cell-type signatures. Assignments were not modified based on Slingshot output. Violin plots were generated using the VlnPlot function in Seurat v5.

ScISOr-seq library preparation and sequencing. ScISOr-seq libraries were prepared from the same 10x Genomics cDNA using the Oxford Nanopore Technologies Ligation Sequencing Kit V14 workflow for single-cell transcriptomics with 3′ cDNA generated using the 10x Genomics platform (SQK-LSK114), according to the manufacturer’s instructions. For each genotype, 10 ng of cDNA amplicons was used as input. Library concentration was monitored using the Qubit dsDNA High Sensitivity Assay on a Qubit 4 fluorometer, and cDNA quality was assessed using the D5000 ScreenTape assay on an Agilent 4200 TapeStation after post-pull-down PCR. Final libraries were normalized to 30 fmol, diluted in Elution Buffer, and loaded onto R10.4.1 flow cells (FLO-PRO114M). Libraries were sequenced on a PromethION P2 Solo instrument. Basecalling was performed using Dorado, and reads were aligned to GRCm39 using minimap2 (61). Cell bar code and UMI demultiplexing were performed using the 10x Cell Ranger (59) long-read workflow to generate transcript-level count matrices. A total of 9,067 long-read cells were retained after quality control, including 4,191 control and 4,876 Esco2F/F;Lyve1-Cre cells. The median numbers of detected isoforms per cell were 1,853 in control cells and 1,346 in mutant cells, with corresponding means of 2,045 and 1,418 isoforms per cell. Mean transcript-detection fractions were 0.217 and 0.172, respectively. Because long-read transcript detection was sparse and lower in mutant cells, isoform-switch analyses emphasized within-gene differential isoform fraction; reduced detection may nevertheless increase sampling variability and limit sensitivity for low-abundance isoforms. Transcript-level matrices were analyzed in Seurat v5 (60) using min.cells = 3 and min.features = 30, followed by normalization and integration using CCA anchors. Clustering at resolution 1.8 identified 27 isoform clusters, which were annotated by marker isoform analysis, Gene Ontology enrichment, and comparison with yolk sac reference signatures (62).

Module score computation. Module scores were computed using the AddModuleScore function in Seurat v5 (60) with 100 expression-matched control features (ctrl = 100) and seed = 42. Gene signatures were curated a priori from published embryonic vascular, EndMT, and yolk sac hematopoietic programs and were not derived from genotype-associated differential expression in the present dataset. The YS Plexus EC identity module comprised Lyve1, Stab2, Cdh5, Kdr, Pecam1, Flt1, Tek, Emcn, Cldn5, Ramp2, and Ptprb. This module combined broadly expressed endothelial junctional and receptor genes with Lyve1 and Stab2, which characterize yolk sac and hemogenic endothelial populations (63, 64). The EndMT module comprised Tagln, Acta2, Col1a1, Col1a2, Col3a1, Vim, Fn1, Snai2, Twist2, Tgfb2, Fbn1, Postn, and Sparc. This 13-gene module incorporated mesenchymal contractile and cytoskeletal genes (Tagln, Acta2, and Vim), extracellular matrix genes (Col1a1, Col1a2, Col3a1, Fn1, Fbn1, Postn, and Sparc), and transition-associated regulators (Snai2, Twist2, and Tgfb2) supported by established EndMT studies (15, 65–69). The EMP fate module comprised Mpo, Spi1, Csf1r, Irf8, Gata1, Klf1, Gypa, and Car2. This module combined myeloid-lineage regulators and markers (Mpo, Spi1, Csf1r, and Irf8) with erythroid-lineage regulators and markers (Gata1, Klf1, Gypa, and Car2), reflecting the dual erythroid and myeloid output of yolk sac erythro-myeloid progenitors (70).

To determine whether the EndMT findings depended on the AddModuleScore algorithm, the identical 13-gene EndMT signature was independently scored using UCell (71), a rank-based single-cell signature-scoring method. Per-cell EndMT scores generated by AddModuleScore and UCell were highly concordant across 7,359 cells (Spearman ρ = 0.936; Pearson r = 0.962). Module scores were analyzed as continuous measures of relative gene-program activity and were not used to assign cluster identities, establish lineage origin, or designate trajectory starting or terminal states.

Differential expression and isoform-switch analysis. Differential expression between mutant and control cells was performed within each cluster using the FindMarkers function in Seurat v5 (60) with a 2-sided Wilcoxon rank-sum test. Isoform-level differential expression was performed using the same framework on transcript-level count matrices. Across 246,538 isoform-level tests, 17,572 isoforms met significance criteria of |log2 fold change| > 0.5 and adjusted P < 0.05. Opposing isoform switches were defined as genes with at least 2 significantly altered isoforms changing in opposite directions within the same cluster. Genes were classified as hidden when they showed a significant isoform switch but no corresponding gene-level differential expression meeting the same fold-change and adjusted P value thresholds. For each of the 1,827 endothelial isoform-switched genes, the most significantly downregulated control-dominant isoform and the most significantly upregulated mutant-dominant isoform were identified from endothelial cluster-specific differential expression results. Transcript consequences were classified from GENCODE vM35 and IsoformSwitchAnalyzeR annotations as protein coding, retained intron, coding sequence not defined, nonsense-mediated decay target, long noncoding RNA or processed transcript, or other noncoding transcript. Open reading frame annotations were obtained from IsoformSwitchAnalyzeR, and genes were classified into 4 protein fate categories: Protein LOST, when the control-dominant isoform was protein coding and the mutant-dominant isoform was noncoding; Protein GAINED, when the control-dominant isoform was noncoding and the mutant-dominant isoform was protein coding; Protein REWIRED, when both isoforms were protein coding but were predicted to encode distinct protein products; and Noncoding gene, when both selected isoforms were noncoding.

IsoformSwitchAnalyzeR pseudobulk analysis. For pseudobulk isoform usage analysis, all 9,067 long-read cells were aggregated by condition and analyzed using IsoformSwitchAnalyzeR. Isoform fraction (IF) was calculated as the expression of an individual transcript divided by the summed expression of all detected transcripts from the same gene. Differential isoform fraction (dIF) was calculated as IF in mutant cells minus IF in control cells. Differential isoform usage was tested using the DEXSeq (72) backend to generate dIF values and q values. ORF analysis was performed using the analyzeORF function with GENCODE vM35 annotations. Switch plots were generated using switchPlot. Where indicated, including the endothelial cell–specific Cald1 analysis in Figure 5G, pseudobulk profiles were generated after restricting the analysis to the endothelial populations.

Trajectory analysis. Trajectory inference was performed using Slingshot (73). For short-read data, trajectories were inferred on UMAP embeddings from the vascular continuum and analyzed independently for each condition, using YS_Plexus_EC as the starting cluster and SMC_mature as the terminal cluster. YS_Plexus_EC was selected as the starting state because it retained the canonical yolk sac endothelial marker profile, whereas SMC_mature was selected as the terminal state based on its differentiated contractile smooth muscle identity. These anchors were assigned from established cell identities and marker expression before trajectory inference and were not selected from genotype-associated module-score differences. For long-read data, trajectories were inferred on a shared UMAP embedding of endothelial and EndMT clusters, also independently for each condition, using YS_Plexus_EC as the starting cluster. No terminal cluster was imposed for the long-read trajectories. Pseudotime values were linearly scaled from 0 to 1 within each condition for visualization and comparison. Pseudotime distributions were compared between conditions using a 2-sample Kolmogorov-Smirnov test.

Isoform-based deconvolution and cross-validation. Long-read signatures were generated for endothelial, EndMT, smooth muscle, hematopoietic, and other cells using the 30 most category-specific isoforms detected in at least 5% of category cells. Deconvolution accuracy was evaluated in 20 iterations per condition by subsampling 30% of cells, summing isoform counts, and estimating category proportions by nonnegative least squares regression (scipy.optimize.nnls). Estimates were normalized to sum to 1 and compared with known proportions using Spearman correlation. Because signatures and mixtures were derived from the same dataset, this analysis evaluated recovery of category proportions rather than independently validating category identities.

Whole-genome sequencing and variant analysis. GFP+ Lyve1-lineage cells were isolated from individual E9.5 yolk sacs using fluorescence-activated cell sorting as described above. Following sorting, cells from each yolk sac were collected and genotyped, and GFP+ cells of the same genotype were pooled for genomic DNA isolation. For each condition, pooled samples were generated from 18 yolk sacs. Cells were collected into AUT lysis buffer from the QIAamp UCP DNA Micro Kit (Qiagen), frozen on dry ice, and stored at −80°C. DNA was purified using the same kit and eluted in nuclease-free water. Libraries were prepared by Novogene using the KAPA HyperPrep kit (Roche) and sequenced on an Illumina NovaSeq platform with 150 bp paired-end reads. Sequencing generated 104.9 Gb for the control sample and 119.1 Gb for the mutant sample, corresponding to approximately 38× and 44× genome coverage, respectively; at least 88% of bases had Phred quality scores of 30 or greater.

FASTQ files were processed using the containerized Dolphin GATK4 pipeline (74) implemented in Nextflow, following the Broad Institute Best Practices for short-read variant discovery. Reads were aligned to the mm10 (GRCm38) reference genome using BWA-MEM, followed by duplicate marking using Picard MarkDuplicates and sorting and indexing using Samtools (75). In the absence of a gold-standard set of known variants for base quality score recalibration (BQSR), a bootstrapping approach was employed: variants were initially called without BQSR, the resulting high-confidence SNPs were used as known sites for recalibration with GATK BaseRecalibrator and ApplyBQSR, and variants were then recalled using GATK HaplotypeCaller v4.3.0.0 in GVCF mode. Variant calling used a minimum confidence threshold of 30, a minimum mapping quality of 20, and a minimum base quality of 18. Variants were hard-filtered using GATK VariantFiltration v4.5.0.0 with the following thresholds: quality by depth less than 2.0, Fisher strand bias greater than 60.0, mapping quality less than 40.0, strand odds ratio greater than 4.0, mapping-quality rank sum less than −12.5, or read-position rank sum less than −8.0.

Variant annotation was performed using SnpEff v5.1d with the GRCm38.75 Ensembl gene models (76). Analyses included primary chromosomes, mitochondrial DNA, and random or unplaced scaffolds without additional repeat masking. The analysis was restricted to single-nucleotide variants and short insertions or deletions; structural variants were not called. After filtering, 48,160 control and 71,862 mutant single-nucleotide variants and 13,561 control and 14,718 mutant short insertions or deletions were retained. Mutant-specific variants were identified by subtracting control heterozygous sites from mutant heterozygous sites by genomic position.

Short-read scRNA-seq and ScISOr-seq analyses were performed on GRCm39 with GENCODE vM35 (77) annotations. Cross-referencing of WGS variants with isoform-switched genes used gene-name matching between SnpEff-annotated GRCm38 variants and the transcriptomic gene set. Coordinate-based classification of variants within gene bodies and promoter regions used the corresponding GRCm38.75 gene annotations, thereby avoiding direct coordinate comparison between GRCm38 and GRCm39. Promoter regions were defined as 2 kb upstream and 500 bp downstream of the transcription start site.

Statistics. All statistical analyses were performed in R v4.4.2 except the immunofluorescence and HUVEC analyses, which were performed in R v4.5. Statistical tests and sample sizes are indicated in the figure legends. Unless otherwise specified, P < 0.05 was considered statistically significant. Mendelian ratios were evaluated using the χ2 goodness-of-fit test, and vascular-compartment composition was compared using the χ2 test of homogeneity. Gene- and isoform-level differential expression within each cluster was assessed using the 2-sided Wilcoxon rank-sum test implemented in Seurat (60) FindMarkers with Bonferroni correction. Genes or isoforms were considered significant at |log2FC| > 0.5 and adjusted P < 0.05. Cluster markers were identified using FindAllMarkers with min.pct = 0.25 and logfc.threshold = 0.25.

Module scores were computed using AddModuleScore and compared between conditions within each cluster using 2-sided Wilcoxon rank-sum tests. For the EndMT continuum, comparisons were performed for YS Plexus EC, Hemogenic EC, EndMT early, and EndMT mid. EndMT_late_1 and EndMT_late_2 were not formally tested because of insufficient control-cell numbers. Concordance between AddModuleScore and UCell scores generated using the identical 13-gene EndMT signature was assessed using Spearman and Pearson correlations. Correlation between endothelial identity and EndMT scores was assessed using Spearman correlation as a prespecified comparison.

Trajectory inference was performed using Slingshot (73), independently for each condition with identical parameters. Pseudotime distributions were compared using the 2-sample Kolmogorov-Smirnov test. For long-read trajectories, pseudotime values were linearly rescaled torange from 0 to 1 within each condition before comparison. Genes were classified as hidden when they showed significant isoform-level alteration but no corresponding gene-level change meeting the same |log2FC| and adjusted P value thresholds. Differential isoform usage in pseudobulk data was tested using IsoformSwitchAnalyzeR (78) with the DEXSeq (72) backend and thresholds of |dIF| > 0.05 and q < 0.05. Protein-fate categories were assigned using differential isoform usage and ORF annotations, and their distributions between hidden and visible genes were compared using the χ2 test.

For tissue immunofluorescence, measurements from individual cells were averaged within each embryo or yolk sac, and comparisons were performed on biological-replicate means using unpaired 2-tailed t tests. Individual cells were displayed to show within-sample variation but were not treated as independent observations. The same approach was used for acetylated SMC3 relative to total SMC3. HUVEC siRNA experiments included at least 3 independent biological replicates per condition and were analyzed by 1-way ANOVA followed by Dunnett’s multiple-comparison test against siControl.

Whole-genome sequencing analyses were performed on pooled mutant and control endothelial samples. Variant effects were annotated using SnpEff, associations between gene-length-normalized variant density and isoform-switch magnitude were assessed using Spearman correlation, and variant densities between hidden and visible genes were compared using the Wilcoxon rank-sum test. For AlphaFold3 (33) analyses, per-residue pLDDT values were extracted and averaged within UniProt-defined domains. No formal statistical tests were applied to pLDDT comparisons because these values derive from single computational models rather than biological replicates. Cross-platform concordance between short-read and long-read cluster assignments was quantified using the adjusted Rand index implemented in mclust (79).

Study approval. All animal procedures were approved by the University of Massachusetts Medical School IACUC. The University of Massachusetts Medical School is accredited by the Association for Assessment and Accreditation of Laboratory Animal Care International and follows Public Health Service Policy for the Care and Use of Laboratory Animals. Animal care was provided in accordance with the Guide for the Care and Use of Laboratory Animals.

Data availability. Single-cell short-read RNA-seq, single-cell long-read RNA-seq, and Esco2 CUT&Tag data generated in this study have been deposited in the Gene Expression Omnibus (GSE344313) and are publicly available. Whole-genome sequencing data have also been deposited in the Sequence Read Archive under BioProject accession number PRJNA1514858 and are publicly available. Values for all data points in graphs are reported in the Supporting Data Values file.

Manuscript information

Author contributions. Conceptualization was contributed by CMT. Methodology was contributed by RJ, SS, and CMT. Data curation was contributed by RJ and CMT. Formal analysis was contributed by RJ, SS, and CMT. Investigation was contributed by RJ, SS, and CMT. Supervision was contributed by CMT. Writing of the original draft was contributed by RJ and CMT. Review and editing were contributed by all authors.

Conflict of interest. AlphaFold 3 was used to predict protein structures of selected isoforms and support comparisons of their predicted structural features. The authors reviewed and interpreted all predictions.

Funding support. This work is the result of NIH funding, in whole or in part, and is subject to the NIH Public Access Policy. Through acceptance of this federal funding, the NIH has been given a right to make the work publicly available in PubMed Central.

  • This work and CMT are supported by NIH grant HL141377 to CMT.
  • NIH training grant T32HL120823 (to RJ).

Address of correspondence. Chinmay M. Trivedi, 368 Plantation St., AS7-1047 Sherman Center, Worcester, Massachusetts 01605, USA. Phone: 508.856.6947; Email: chinmay.trivedi@umassmed.edu.

Supplemental material

View Supplemental data

View Supplemental table 1

View Supplemental table 2

View Supplemental table 3

View Supplemental table 4

View Supporting data values

Footnotes

Copyright: © 2026, Jung et al. This is an open access article published under the terms of the Creative Commons Attribution 4.0 International License.

Reference information: JCI Insight. 2026;11(21):e208649.https://doi.org/10.1172/jci.insight.208649.

References
  1. Ekong CE, Rozdilsky B. Hydranencephaly in association with Roberts syndrome. Can J Neurol Sci. 1978;5(2):253–255.
    View this article via: CrossRef PubMed Google Scholar
  2. Da Silva EO, Bezerra LH. The Roberts syndrome. Hum Genet. 1982;61(4):372–374.
    View this article via: CrossRef PubMed Google Scholar
  3. Mann NP, et al. Roberts syndrome: clinical and cytogenetic aspects. J Med Genet. 1982;19(2):116–119.
    View this article via: CrossRef PubMed Google Scholar
  4. Petrinelli P, et al. Premature centromere splitting in a presumptive mild form of Roberts syndrome. Hum Genet. 1984;66(1):96–99.
    View this article via: CrossRef PubMed Google Scholar
  5. Mfarej MG, Skibbens RV. An ever-changing landscape in Roberts syndrome biology: implications for macromolecular damage. PLoS Genet. 2020;16(12):e1009219.
    View this article via: CrossRef PubMed Google Scholar
  6. Piche J, et al. The expanding phenotypes of cohesinopathies: one ring to rule them all! Cell Cycle. 2019;18(21):2828–2848.
    View this article via: CrossRef PubMed Google Scholar
  7. Banerji R, et al. How many roads lead to cohesinopathies? Dev Dyn. 2017;246(11):881–888.
    View this article via: CrossRef PubMed Google Scholar
  8. Terret ME, et al. Cohesin acetylation speeds the replication fork. Nature. 2009;462(7270):231–234.
    View this article via: CrossRef PubMed Google Scholar
  9. Losada A. Cohesin in cancer: chromosome segregation and beyond. Nat Rev Cancer. 2014;14(6):389–393.
    View this article via: CrossRef PubMed Google Scholar
  10. Davidson IF, Peters JM. Genome folding through loop extrusion by SMC complexes. Nat Rev Mol Cell Biol. 2021;22(7):445–464.
    View this article via: CrossRef PubMed Google Scholar
  11. Hansen AS. CTCF as a boundary factor for cohesin-mediated loop extrusion: evidence for a multi-step mechanism. Nucleus. 2020;11(1):132–148.
    View this article via: CrossRef PubMed Google Scholar
  12. Barshad G, et al. RNA polymerase II dynamics shape enhancer-promoter interactions. Nat Genet. 2023;55(8):1370–1380.
    View this article via: CrossRef PubMed Google Scholar
  13. Zhang S, et al. Enhancer-promoter contact formation requires RNAPII and antagonizes loop extrusion. Nat Genet. 2023;55(5):832–840.
    View this article via: CrossRef PubMed Google Scholar
  14. Zuilkoski CM, Skibbens RV. Integrating sister chromatid cohesion establishment to DNA replication. Genes (Basel). 2022;13(4):625.
    View this article via: CrossRef PubMed Google Scholar
  15. Dejana E, et al. The molecular basis of endothelial cell plasticity. Nat Commun. 2017;8:14361.
    View this article via: CrossRef PubMed Google Scholar
  16. Kovacic JC, et al. Endothelial to mesenchymal transition in cardiovascular disease: JACC state-of-the-art review. J Am Coll Cardiol. 2019;73(2):190–209.
    View this article via: CrossRef PubMed Google Scholar
  17. Plein A, et al. Erythro-myeloid progenitors contribute endothelial cells to blood vessels. Nature. 2018;562(7726):223–228.
    View this article via: CrossRef PubMed Google Scholar
  18. Chen PY, et al. Endothelial TGF-β signalling drives vascular inflammation and atherosclerosis. Nat Metab. 2019;1(9):912–926.
    View this article via: CrossRef PubMed Google Scholar
  19. Corada M, et al. Sox17 is indispensable for acquisition and maintenance of arterial identity. Nat Commun. 2013;4:2609.
    View this article via: CrossRef PubMed Google Scholar
  20. Dekker RJ, et al. KLF2 provokes a gene expression pattern that establishes functional quiescent differentiation of the endothelium. Blood. 2006;107(11):4354–4363.
    View this article via: CrossRef PubMed Google Scholar
  21. Shah AV, et al. Regulation of endothelial homeostasis, vascular development and angiogenesis by the transcription factor ERG. Vascul Pharmacol. 2016;86:3–13.
    View this article via: CrossRef PubMed Google Scholar
  22. Nilsen TW, Graveley BR. Expansion of the eukaryotic proteome by alternative splicing. Nature. 2010;463(7280):457–463.
    View this article via: CrossRef PubMed Google Scholar
  23. Pan Q, et al. Deep surveying of alternative splicing complexity in the human transcriptome by high-throughput sequencing. Nat Genet. 2008;40(12):1413–1415.
    View this article via: CrossRef PubMed Google Scholar
  24. Kalsotra A, et al. A postnatal switch of CELF and MBNL proteins reprograms alternative splicing in the developing heart. Proc Natl Acad Sci U S A. 2008;105(51):20333–20338.
    View this article via: CrossRef PubMed Google Scholar
  25. Linares AJ, et al. The splicing regulator PTBP1 controls the activity of the transcription factor Pbx1 during neuronal differentiation. Elife. 2015;4:e09268.
    View this article via: CrossRef PubMed Google Scholar
  26. Vuong JK, et al. PTBP1 and PTBP2 serve both specific and redundant functions in neuronal pre-mRNA splicing. Cell Rep. 2016;17(10):2766–2775.
    View this article via: CrossRef PubMed Google Scholar
  27. Wang ET, et al. Alternative isoform regulation in human tissue transcriptomes. Nature. 2008;456(7221):470–476.
    View this article via: CrossRef PubMed Google Scholar
  28. Warzecha CC, et al. ESRP1 and ESRP2 are epithelial cell-type–specific regulators of FGFR2 splicing. Mol Cell. 2009;33(5):591–601.
    View this article via: CrossRef PubMed Google Scholar
  29. Yang Y, et al. Determination of a comprehensive alternative splicing regulatory network and combinatorial regulation by key factors during the epithelial-mesenchymal transition. Mol Cell Biol. 2016;36(11):1704–1719.
    View this article via: CrossRef PubMed Google Scholar
  30. Al’Khafaji AM, et al. High-throughput RNA isoform sequencing using programmed cDNA concatenation. Nat Biotechnol. 2024;42(4):582–586.
    View this article via: CrossRef PubMed Google Scholar
  31. Hardwick SA, et al. Single-nuclei isoform RNA-seq unlocks bar coded exon connectivity in frozen brain tissue. Nat Biotechnol. 2022;40(7):1082–1092.
    View this article via: CrossRef PubMed Google Scholar
  32. Joglekar A, et al. A spatially resolved brain region- and cell type-specific isoform atlas of the postnatal mouse brain. Nat Commun. 2021;12(1):463.
    View this article via: CrossRef PubMed Google Scholar
  33. Abramson J, et al. Accurate structure prediction of biomolecular interactions with AlphaFold 3. Nature. 2024;630(8016):493–500.
    View this article via: CrossRef PubMed Google Scholar
  34. Tian L, et al. Comprehensive characterization of single-cell full-length isoforms in human and mouse with long-read sequencing. Genome Biol. 2021;22(1):310.
    View this article via: CrossRef PubMed Google Scholar
  35. Shepard PJ, Hertel KJ. The SR protein family. Genome Biol. 2009;10(10):242.
    View this article via: CrossRef PubMed Google Scholar
  36. Anczukow O, et al. SRSF1-regulated alternative splicing in breast cancer. Mol Cell. 2015;60(1):105–117.
    View this article via: CrossRef PubMed Google Scholar
  37. Pandit S, et al. Genome-wide analysis reveals SR protein cooperation and competition in regulated splicing. Mol Cell. 2013;50(2):223–235.
    View this article via: CrossRef PubMed Google Scholar
  38. Dvinge H. Regulation of alternative mRNA splicing: old players and new perspectives. FEBS Lett. 2018;592(17):2987–3006.
    View this article via: CrossRef PubMed Google Scholar
  39. Geuens T, et al. The hnRNP family: insights into their role in health and disease. Hum Genet. 2016;135(8):851–867.
    View this article via: CrossRef PubMed Google Scholar
  40. Wang ET, et al. Transcriptome-wide regulation of pre-mRNA splicing and mRNA localization by muscleblind proteins. Cell. 2012;150(4):710–724.
    View this article via: CrossRef PubMed Google Scholar
  41. Karni R, et al. The gene encoding the splicing factor SF2/ASF is a proto-oncogene. Nat Struct Mol Biol. 2007;14(3):185–193.
    View this article via: CrossRef PubMed Google Scholar
  42. Dujardin G, et al. How slow RNA polymerase II elongation favors alternative exon skipping. Mol Cell. 2014;54(4):683–690.
    View this article via: CrossRef PubMed Google Scholar
  43. Naftelberg S, et al. Regulation of alternative splicing through coupling with transcription and chromatin structure. Annu Rev Biochem. 2015;84:165–198.
    View this article via: CrossRef PubMed Google Scholar
  44. Xu Y, et al. Cell type-restricted activity of hnRNPM promotes breast cancer metastasis via regulating alternative splicing. Genes Dev. 2014;28(11):1191–1203.
    View this article via: CrossRef PubMed Google Scholar
  45. Shapiro IM, et al. An EMT-driven alternative splicing program occurs in human breast cancer and modulates cellular phenotype. PLoS Genet. 2011;7(8):e1002218.
    View this article via: CrossRef PubMed Google Scholar
  46. Hocevar BA, et al. TGF-beta induces fibronectin synthesis through a c-Jun N-terminal kinase-dependent, Smad4-independent pathway. EMBO J. 1999;18(5):1345–1356.
    View this article via: CrossRef PubMed Google Scholar
  47. Penheiter SG, et al. Type II transforming growth factor-beta receptor recycling is dependent upon the clathrin adaptor protein Dab2. Mol Biol Cell. 2010;21(22):4009–4019.
    View this article via: CrossRef PubMed Google Scholar
  48. Okamoto K, et al. Caldesmon isoform associated with phenotypic modulation of mesangial cells. Exp Nephrol. 2000;8(1):20–27.
    View this article via: CrossRef PubMed Google Scholar
  49. Poschl E, et al. Collagen IV is essential for basement membrane stability but dispensable for initiation of its assembly during early development. Development. 2004;131(7):1619–1628.
    View this article via: CrossRef PubMed Google Scholar
  50. Singh AK, et al. Cohesin regulates alternative splicing. Sci Adv. 2023;9(9):eade3876.
    View this article via: CrossRef PubMed Google Scholar
  51. Boisset JC, et al. In vivo imaging of haematopoietic cells emerging from the mouse aortic endothelium. Nature. 2010;464(7285):116–120.
    View this article via: CrossRef PubMed Google Scholar
  52. Chen MJ, et al. Erythroid/myeloid progenitors and hematopoietic stem cells originate from distinct populations of endothelial cells. Cell Stem Cell. 2011;9(6):541–552.
    View this article via: CrossRef PubMed Google Scholar
  53. Lancrin C, et al. GFI1 and GFI1B control the loss of endothelial identity of hemogenic endothelium during hematopoietic commitment. Blood. 2012;120(2):314–322.
    View this article via: CrossRef PubMed Google Scholar
  54. Zovein AC, et al. Fate tracing reveals the endothelial origin of hematopoietic stem cells. Cell Stem Cell. 2008;3(6):625–636.
    View this article via: CrossRef PubMed Google Scholar
  55. Muzumdar MD, et al. A global double-fluorescent Cre reporter mouse. Genesis. 2007;45(9):593–605.
    View this article via: CrossRef PubMed Google Scholar
  56. Pham TH, et al. Lymphatic endothelial cell sphingosine kinase activity is required for lymphocyte egress and lymphatic patterning. J Exp Med. 2010;207(1):17–27.
    View this article via: CrossRef PubMed Google Scholar
  57. Sorensen I, et al. DLL1-mediated Notch activation regulates endothelial identity in mouse fetal arteries. Blood. 2009;113(22):5680–5688.
    View this article via: CrossRef PubMed Google Scholar
  58. Whelan G, et al. Cohesin acetyltransferase Esco2 is a cell viability factor and is required for cohesion in pericentric heterochromatin. EMBO J. 2012;31(1):71–82.
    View this article via: CrossRef PubMed Google Scholar
  59. Zheng GX, et al. Massively parallel digital transcriptional profiling of single cells. Nat Commun. 2017;8:14049.
    View this article via: CrossRef PubMed Google Scholar
  60. Hao Y, et al. Dictionary learning for integrative, multimodal and scalable single-cell analysis. Nat Biotechnol. 2024;42(2):293–304.
    View this article via: CrossRef PubMed Google Scholar
  61. Li H. Minimap2: pairwise alignment for nucleotide sequences. Bioinformatics. 2018;34(18):3094–3100.
    View this article via: CrossRef PubMed Google Scholar
  62. Neo WH, et al. Single-cell profiling reveals three endothelial-to-hematopoietic transitions with divergent isoform expression landscapes. Nat Cardiovasc Res. 2025;4(12):1642–1661.
    View this article via: CrossRef PubMed Google Scholar
  63. Lee LK, et al. LYVE1 marks the divergence of yolk Sac definitive hemogenic endothelium from the primitive erythroid lineage. Cell Rep. 2016;17(9):2286–2298.
    View this article via: CrossRef PubMed Google Scholar
  64. Pijuan-Sala B, et al. A single-cell molecular map of mouse gastrulation and early organogenesis. Nature. 2019;566(7745):490–495.
    View this article via: CrossRef PubMed Google Scholar
  65. Bischoff J. Endothelial-mesenchymal transition. Circ Res. 2019;124(8):1163–1165.
    View this article via: CrossRef PubMed Google Scholar
  66. Gorelova A, et al. Endothelial-mesenchymal transition in pulmonary arterial hypertension. Antioxid Redox Signal. 2021;34(12):891–914.
    View this article via: CrossRef PubMed Google Scholar
  67. Piera-Velazquez S, Jimenez SA. Endothelial to mesenchymal transition: role in physiology and in the pathogenesis of human diseases. Physiol Rev. 2019;99(2):1281–1324.
    View this article via: CrossRef PubMed Google Scholar
  68. Tombor LS, et al. Single cell sequencing reveals endothelial plasticity with transient mesenchymal activation after myocardial infarction. Nat Commun. 2021;12(1):681.
    View this article via: CrossRef PubMed Google Scholar
  69. Zeisberg EM, et al. Endothelial-mesenchymal transition contributes to cardiac fibrosis. Nat Med. 2007;13(8):952–961.
    View this article via: CrossRef PubMed Google Scholar
  70. Soares-da-Silva F, et al. Yolk sac, but not hematopoietic stem cell-derived progenitors, sustain erythropoiesis throughout murine embryonic life. J Exp Med. 2021;218(4):e20201729.
    View this article via: CrossRef PubMed Google Scholar
  71. Andreatta M, Carmona SJ. UCell: robust and scalable single-cell gene signature scoring. Comput Struct Biotechnol J. 2021;19:3796–3798.
    View this article via: CrossRef PubMed Google Scholar
  72. Anders S, et al. Detecting differential usage of exons from RNA-seq data. Genome Res. 2012;22(10):2008–2017.
    View this article via: CrossRef PubMed Google Scholar
  73. Street K, et al. Slingshot: cell lineage and pseudotime inference for single-cell transcriptomics. BMC Genomics. 2018;19(1):477.
    View this article via: CrossRef PubMed Google Scholar
  74. McKenna A, et al. The genome analysis toolkit: a MapReduce framework for analyzing next-generation DNA sequencing data. Genome Res. 2010;20(9):1297–1303.
    View this article via: CrossRef PubMed Google Scholar
  75. Li H, et al. The sequence alignment/map format and SAMtools. Bioinformatics. 2009;25(16):2078–2079.
    View this article via: CrossRef PubMed Google Scholar
  76. Cingolani P, et al. A program for annotating and predicting the effects of single nucleotide polymorphisms, SnpEff: SNPs in the genome of Drosophila melanogaster strain w 1118 iso-2; iso-3. Fly (Austin). 1118;6(2):80–92.
    View this article via: CrossRef PubMed Google Scholar
  77. Frankish A, et al. GENCODE 2021. Nucleic Acids Res. 2021;49(d1):D916–D923.
    View this article via: CrossRef PubMed Google Scholar
  78. Vitting-Seerup K, Sandelin A. IsoformSwitchAnalyzeR: analysis of changes in genome-wide patterns of alternative splicing and its functional consequences. Bioinformatics. 2019;35(21):4469–4471.
    View this article via: CrossRef PubMed Google Scholar
  79. Scrucca L, et al. mclust 5: Clustering, classification and density estimation using Gaussian finite mixture models. R J. 2016;8(1):289–317.
    View this article via: CrossRef PubMed Google Scholar
Version history
  • Version 1 (November 9, 2026): Electronic publication

Article tools

  • View PDF
  • Download citation information
  • Send a comment
  • Terms of use
  • Standard abbreviations
  • Need help? Email the journal

Metrics

  • Article usage
  • Citations to this article

Go to

  • Top
  • Abstract
  • Introduction
  • Results
  • Discussion
  • Methods
  • Manuscript information
  • Supplemental material
  • Footnotes
  • References
  • Version history
Advertisement
Advertisement

Copyright © 2026 American Society for Clinical Investigation
ISSN 2379-3708

Sign up for email alerts