
Research ArticleCell biologyGeneticsNeuroscience
Open Access |  10.1172/jci.insight.202204
CRISPR/Cas9 loss-of-function screen in a neuronal model of AP-4 deficiency identifies ATG9A trafficking modulators
Marvin Ziegler,1,2 Cedric Günter,1,3 Julian E. Alecu,1 Xutong Xue,1 Hyo M. Kim,1 Afshin Saffari,1,4 Alexandra K. Davies,5,6 Mustafa Sahin,1,7 and Darius Ebrahimi-Fakhari1,8
1Department of Neurology and F.M. Kirby Neurobiology Center, Boston Children’s Hospital, Harvard Medical School, Boston, Massachusetts, USA.
2Department of Functional Neuroanatomy, Institute of Anatomy and Cell Biology, Heidelberg University, Heidelberg, Germany.
3Laboratory for Axon Growth and Regeneration, German Center for Neurodegenerative Diseases, Bonn, Germany.
4Heidelberg University, Medical Faculty Heidelberg, University Hospital Heidelberg, Center for Pediatrics and Adolescent Medicine, Department of Pediatrics I, Division of Child Neurology and Metabolic Medicine, Heidelberg, Germany.
5School of Biological Sciences, Faculty of Biology, Medicine and Health, Manchester Academic Health Science Centre, University of Manchester, Manchester, United Kingdom.
6Department of Proteomics and Signal Transduction, Max Planck Institute of Biochemistry, Martinsried, Germany.
7Rosamund Stone Zander and Hansjoerg Wyss Translational Neuroscience Center, Boston Children’s Hospital, Harvard Medical School, Boston, Massachusetts, USA.
8Movement Disorders Program, Boston Children’s Hospital, Harvard Medical School, Boston, Massachusetts, USA.
Address correspondence to: Darius Ebrahimi-Fakhari, Movement Disorders Program, Department of Neurology, Boston Children’s Hospital, CLSB 2nd floor, 3 Blackfan Circle, Boston, Massachusetts 02115, USA. Phone: 617.355.8356; Email: darius.ebrahimi-fakhari@childrens.harvard.edu.
Authorship note: CG and JEA contributed equally to this work.
Find articles by
Ziegler, M.
in:
PubMed
|
Google Scholar
|

1Department of Neurology and F.M. Kirby Neurobiology Center, Boston Children’s Hospital, Harvard Medical School, Boston, Massachusetts, USA.
2Department of Functional Neuroanatomy, Institute of Anatomy and Cell Biology, Heidelberg University, Heidelberg, Germany.
3Laboratory for Axon Growth and Regeneration, German Center for Neurodegenerative Diseases, Bonn, Germany.
4Heidelberg University, Medical Faculty Heidelberg, University Hospital Heidelberg, Center for Pediatrics and Adolescent Medicine, Department of Pediatrics I, Division of Child Neurology and Metabolic Medicine, Heidelberg, Germany.
5School of Biological Sciences, Faculty of Biology, Medicine and Health, Manchester Academic Health Science Centre, University of Manchester, Manchester, United Kingdom.
6Department of Proteomics and Signal Transduction, Max Planck Institute of Biochemistry, Martinsried, Germany.
7Rosamund Stone Zander and Hansjoerg Wyss Translational Neuroscience Center, Boston Children’s Hospital, Harvard Medical School, Boston, Massachusetts, USA.
8Movement Disorders Program, Boston Children’s Hospital, Harvard Medical School, Boston, Massachusetts, USA.
Address correspondence to: Darius Ebrahimi-Fakhari, Movement Disorders Program, Department of Neurology, Boston Children’s Hospital, CLSB 2nd floor, 3 Blackfan Circle, Boston, Massachusetts 02115, USA. Phone: 617.355.8356; Email: darius.ebrahimi-fakhari@childrens.harvard.edu.
Authorship note: CG and JEA contributed equally to this work.
Find articles by Günter, C. in: PubMed | Google Scholar
1Department of Neurology and F.M. Kirby Neurobiology Center, Boston Children’s Hospital, Harvard Medical School, Boston, Massachusetts, USA.
2Department of Functional Neuroanatomy, Institute of Anatomy and Cell Biology, Heidelberg University, Heidelberg, Germany.
3Laboratory for Axon Growth and Regeneration, German Center for Neurodegenerative Diseases, Bonn, Germany.
4Heidelberg University, Medical Faculty Heidelberg, University Hospital Heidelberg, Center for Pediatrics and Adolescent Medicine, Department of Pediatrics I, Division of Child Neurology and Metabolic Medicine, Heidelberg, Germany.
5School of Biological Sciences, Faculty of Biology, Medicine and Health, Manchester Academic Health Science Centre, University of Manchester, Manchester, United Kingdom.
6Department of Proteomics and Signal Transduction, Max Planck Institute of Biochemistry, Martinsried, Germany.
7Rosamund Stone Zander and Hansjoerg Wyss Translational Neuroscience Center, Boston Children’s Hospital, Harvard Medical School, Boston, Massachusetts, USA.
8Movement Disorders Program, Boston Children’s Hospital, Harvard Medical School, Boston, Massachusetts, USA.
Address correspondence to: Darius Ebrahimi-Fakhari, Movement Disorders Program, Department of Neurology, Boston Children’s Hospital, CLSB 2nd floor, 3 Blackfan Circle, Boston, Massachusetts 02115, USA. Phone: 617.355.8356; Email: darius.ebrahimi-fakhari@childrens.harvard.edu.
Authorship note: CG and JEA contributed equally to this work.
Find articles by Alecu, J. in: PubMed | Google Scholar
1Department of Neurology and F.M. Kirby Neurobiology Center, Boston Children’s Hospital, Harvard Medical School, Boston, Massachusetts, USA.
2Department of Functional Neuroanatomy, Institute of Anatomy and Cell Biology, Heidelberg University, Heidelberg, Germany.
3Laboratory for Axon Growth and Regeneration, German Center for Neurodegenerative Diseases, Bonn, Germany.
4Heidelberg University, Medical Faculty Heidelberg, University Hospital Heidelberg, Center for Pediatrics and Adolescent Medicine, Department of Pediatrics I, Division of Child Neurology and Metabolic Medicine, Heidelberg, Germany.
5School of Biological Sciences, Faculty of Biology, Medicine and Health, Manchester Academic Health Science Centre, University of Manchester, Manchester, United Kingdom.
6Department of Proteomics and Signal Transduction, Max Planck Institute of Biochemistry, Martinsried, Germany.
7Rosamund Stone Zander and Hansjoerg Wyss Translational Neuroscience Center, Boston Children’s Hospital, Harvard Medical School, Boston, Massachusetts, USA.
8Movement Disorders Program, Boston Children’s Hospital, Harvard Medical School, Boston, Massachusetts, USA.
Address correspondence to: Darius Ebrahimi-Fakhari, Movement Disorders Program, Department of Neurology, Boston Children’s Hospital, CLSB 2nd floor, 3 Blackfan Circle, Boston, Massachusetts 02115, USA. Phone: 617.355.8356; Email: darius.ebrahimi-fakhari@childrens.harvard.edu.
Authorship note: CG and JEA contributed equally to this work.
Find articles by Xue, X. in: PubMed | Google Scholar
1Department of Neurology and F.M. Kirby Neurobiology Center, Boston Children’s Hospital, Harvard Medical School, Boston, Massachusetts, USA.
2Department of Functional Neuroanatomy, Institute of Anatomy and Cell Biology, Heidelberg University, Heidelberg, Germany.
3Laboratory for Axon Growth and Regeneration, German Center for Neurodegenerative Diseases, Bonn, Germany.
4Heidelberg University, Medical Faculty Heidelberg, University Hospital Heidelberg, Center for Pediatrics and Adolescent Medicine, Department of Pediatrics I, Division of Child Neurology and Metabolic Medicine, Heidelberg, Germany.
5School of Biological Sciences, Faculty of Biology, Medicine and Health, Manchester Academic Health Science Centre, University of Manchester, Manchester, United Kingdom.
6Department of Proteomics and Signal Transduction, Max Planck Institute of Biochemistry, Martinsried, Germany.
7Rosamund Stone Zander and Hansjoerg Wyss Translational Neuroscience Center, Boston Children’s Hospital, Harvard Medical School, Boston, Massachusetts, USA.
8Movement Disorders Program, Boston Children’s Hospital, Harvard Medical School, Boston, Massachusetts, USA.
Address correspondence to: Darius Ebrahimi-Fakhari, Movement Disorders Program, Department of Neurology, Boston Children’s Hospital, CLSB 2nd floor, 3 Blackfan Circle, Boston, Massachusetts 02115, USA. Phone: 617.355.8356; Email: darius.ebrahimi-fakhari@childrens.harvard.edu.
Authorship note: CG and JEA contributed equally to this work.
Find articles by Kim, H. in: PubMed | Google Scholar
1Department of Neurology and F.M. Kirby Neurobiology Center, Boston Children’s Hospital, Harvard Medical School, Boston, Massachusetts, USA.
2Department of Functional Neuroanatomy, Institute of Anatomy and Cell Biology, Heidelberg University, Heidelberg, Germany.
3Laboratory for Axon Growth and Regeneration, German Center for Neurodegenerative Diseases, Bonn, Germany.
4Heidelberg University, Medical Faculty Heidelberg, University Hospital Heidelberg, Center for Pediatrics and Adolescent Medicine, Department of Pediatrics I, Division of Child Neurology and Metabolic Medicine, Heidelberg, Germany.
5School of Biological Sciences, Faculty of Biology, Medicine and Health, Manchester Academic Health Science Centre, University of Manchester, Manchester, United Kingdom.
6Department of Proteomics and Signal Transduction, Max Planck Institute of Biochemistry, Martinsried, Germany.
7Rosamund Stone Zander and Hansjoerg Wyss Translational Neuroscience Center, Boston Children’s Hospital, Harvard Medical School, Boston, Massachusetts, USA.
8Movement Disorders Program, Boston Children’s Hospital, Harvard Medical School, Boston, Massachusetts, USA.
Address correspondence to: Darius Ebrahimi-Fakhari, Movement Disorders Program, Department of Neurology, Boston Children’s Hospital, CLSB 2nd floor, 3 Blackfan Circle, Boston, Massachusetts 02115, USA. Phone: 617.355.8356; Email: darius.ebrahimi-fakhari@childrens.harvard.edu.
Authorship note: CG and JEA contributed equally to this work.
Find articles by Saffari, A. in: PubMed | Google Scholar
1Department of Neurology and F.M. Kirby Neurobiology Center, Boston Children’s Hospital, Harvard Medical School, Boston, Massachusetts, USA.
2Department of Functional Neuroanatomy, Institute of Anatomy and Cell Biology, Heidelberg University, Heidelberg, Germany.
3Laboratory for Axon Growth and Regeneration, German Center for Neurodegenerative Diseases, Bonn, Germany.
4Heidelberg University, Medical Faculty Heidelberg, University Hospital Heidelberg, Center for Pediatrics and Adolescent Medicine, Department of Pediatrics I, Division of Child Neurology and Metabolic Medicine, Heidelberg, Germany.
5School of Biological Sciences, Faculty of Biology, Medicine and Health, Manchester Academic Health Science Centre, University of Manchester, Manchester, United Kingdom.
6Department of Proteomics and Signal Transduction, Max Planck Institute of Biochemistry, Martinsried, Germany.
7Rosamund Stone Zander and Hansjoerg Wyss Translational Neuroscience Center, Boston Children’s Hospital, Harvard Medical School, Boston, Massachusetts, USA.
8Movement Disorders Program, Boston Children’s Hospital, Harvard Medical School, Boston, Massachusetts, USA.
Address correspondence to: Darius Ebrahimi-Fakhari, Movement Disorders Program, Department of Neurology, Boston Children’s Hospital, CLSB 2nd floor, 3 Blackfan Circle, Boston, Massachusetts 02115, USA. Phone: 617.355.8356; Email: darius.ebrahimi-fakhari@childrens.harvard.edu.
Authorship note: CG and JEA contributed equally to this work.
Find articles by Davies, A. in: PubMed | Google Scholar
1Department of Neurology and F.M. Kirby Neurobiology Center, Boston Children’s Hospital, Harvard Medical School, Boston, Massachusetts, USA.
2Department of Functional Neuroanatomy, Institute of Anatomy and Cell Biology, Heidelberg University, Heidelberg, Germany.
3Laboratory for Axon Growth and Regeneration, German Center for Neurodegenerative Diseases, Bonn, Germany.
4Heidelberg University, Medical Faculty Heidelberg, University Hospital Heidelberg, Center for Pediatrics and Adolescent Medicine, Department of Pediatrics I, Division of Child Neurology and Metabolic Medicine, Heidelberg, Germany.
5School of Biological Sciences, Faculty of Biology, Medicine and Health, Manchester Academic Health Science Centre, University of Manchester, Manchester, United Kingdom.
6Department of Proteomics and Signal Transduction, Max Planck Institute of Biochemistry, Martinsried, Germany.
7Rosamund Stone Zander and Hansjoerg Wyss Translational Neuroscience Center, Boston Children’s Hospital, Harvard Medical School, Boston, Massachusetts, USA.
8Movement Disorders Program, Boston Children’s Hospital, Harvard Medical School, Boston, Massachusetts, USA.
Address correspondence to: Darius Ebrahimi-Fakhari, Movement Disorders Program, Department of Neurology, Boston Children’s Hospital, CLSB 2nd floor, 3 Blackfan Circle, Boston, Massachusetts 02115, USA. Phone: 617.355.8356; Email: darius.ebrahimi-fakhari@childrens.harvard.edu.
Authorship note: CG and JEA contributed equally to this work.
Find articles by
Sahin, M.
in:
PubMed
|
Google Scholar
|
1Department of Neurology and F.M. Kirby Neurobiology Center, Boston Children’s Hospital, Harvard Medical School, Boston, Massachusetts, USA.
2Department of Functional Neuroanatomy, Institute of Anatomy and Cell Biology, Heidelberg University, Heidelberg, Germany.
3Laboratory for Axon Growth and Regeneration, German Center for Neurodegenerative Diseases, Bonn, Germany.
4Heidelberg University, Medical Faculty Heidelberg, University Hospital Heidelberg, Center for Pediatrics and Adolescent Medicine, Department of Pediatrics I, Division of Child Neurology and Metabolic Medicine, Heidelberg, Germany.
5School of Biological Sciences, Faculty of Biology, Medicine and Health, Manchester Academic Health Science Centre, University of Manchester, Manchester, United Kingdom.
6Department of Proteomics and Signal Transduction, Max Planck Institute of Biochemistry, Martinsried, Germany.
7Rosamund Stone Zander and Hansjoerg Wyss Translational Neuroscience Center, Boston Children’s Hospital, Harvard Medical School, Boston, Massachusetts, USA.
8Movement Disorders Program, Boston Children’s Hospital, Harvard Medical School, Boston, Massachusetts, USA.
Address correspondence to: Darius Ebrahimi-Fakhari, Movement Disorders Program, Department of Neurology, Boston Children’s Hospital, CLSB 2nd floor, 3 Blackfan Circle, Boston, Massachusetts 02115, USA. Phone: 617.355.8356; Email: darius.ebrahimi-fakhari@childrens.harvard.edu.
Authorship note: CG and JEA contributed equally to this work.
Find articles by
Ebrahimi-Fakhari, D.
in:
PubMed
|
Google Scholar
|
Published May 19, 2026 - More info
JCI Insight. 2026;11(14):e202204. https://doi.org/10.1172/jci.insight.202204.
© 2026 Ziegler et al. This work is licensed under the Creative Commons Attribution 4.0 International License. To view a copy of this license, visit http://creativecommons.org/licenses/by/4.0/.

-
Results
Establishing a phenotypic high-content screen for modulators of ATG9A trafficking.
We previously developed and validated a high-content imaging–based assay to measure intracellular ATG9A distribution as a surrogate for AP-4 function (26, 27). To identify modulators of ATG9A trafficking in AP-4–deficient cells, we have now leveraged this assay to conduct an arrayed CRISPR/Cas9–based loss-of-function screen (Figure 1A). Given that AP-4-HSP predominantly affects cortical and spinal neurons, we used the SH-SY5Y neuroblastoma cell line, which can be differentiated with retinoic acid into a neuron-like state resembling cholinergic neurons (28). For this study, we used SH-SY5Y cells stably expressing wild-type Cas9, with and without expression of an sgRNA to knock out AP4B1 (10). Western blot analysis confirmed Cas9 expression and the absence of AP4B1 protein in AP4B1KO cells, which also displayed reduced levels of AP4E1, consistent with diminished overall AP-4 complex formation. As previously observed in other AP-4–deficient cells (9, 10, 14), ATG9A protein levels were elevated in AP4B1KO cells (Figure 1B and Supplemental Figure 1; supplemental material available online with this article; https://doi.org/10.1172/jci.insight.202204DS1).
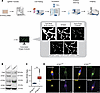 Figure 1
Establishment of a high-content CRISPR/Cas9 loss-of-function screening platform. (A) Experimental workflow for CRISPR/Cas9 screen. Control and library sgRNAs were transferred into 384-well plates preloaded with Lipofectamine RNAiMAX. Differentiated Cas9-expressing SH-SY5Y cells were plated on top and incubated with sgRNAs for 72 hours. Cells were subsequently fixed and stained with Hoechst 33258 (nuclear marker), β-tubulin III (cytoplasmic marker), TGN46 (trans-Golgi network marker), and ATG9A (ATG9A compartment marker). Plates were imaged using an automated high-content imaging platform (Molecular Devices ImageXpress Micro Confocal Laser System and Peak Analysis & Automation GX robot arm), and images were analyzed using an automated pipeline in MetaXpress to segment cells and calculate the proportion of ATG9A signal overlapping with the TGN. This figure was partially created in BioRender (Kim H, 2026, https://BioRender.com/jrlyt8e). Cellular compartment masks were derived from MetaXpress. (B) Western blot analysis of whole-cell lysates from differentiated AP4B1KO and AP4B1WT SH-SY5Y cells. AP4B1KO cells showed loss of AP4B1 protein and reduced levels of AP4E1, indicating successful AP4B1 knockout and decreased AP-4 complex formation. ATG9A levels were increased in AP4B1KO cells. Both cell lines demonstrated stable expression of Cas9. (C) ATG9A ratio of untransfected AP4B1KO and AP4B1WT cells, based on all wells from the primary screen. AP4B1KO cells showed a significant increase in the ATG9A ratio, consistent with accumulation of ATG9A in the TGN. Statistical analysis: 2-sided Student’s t test, ***P < 0.001, Cohen’s d ≈ 2.74. (D) Representative images of AP4B1KO and AP4B1WT SH-SY5Y cells stained with antibodies against ATG9A and TGN46. AP4B1KO cells exhibited perinuclear accumulation of ATG9A overlapping with the TGN. Pseudocolored images depict grayscale intensity. Scale bars: 10 μm.
For the CRISPR/Cas9–based loss-of-function screen, SH-SY5Y cells were reversely transfected with the Synthego sgRNA Human Druggable Genome library and incubated for 72 hours. To ensure high consistency and minimize variability, we used automated systems, including sgRNA transfer, pipetting, and liquid dispensing. High-content imaging at ×40 magnification was performed using the ImageXpress Micro high-content imaging system, followed by automated analysis of individual cells with hundreds of cells per well (AP4B1WT, 930.342 ± 318.332; AP4B1KO, 845.354 ± 289.564) using a custom pipeline developed with MetaXpress software. Cellular compartments were labeled with 4 markers: Hoechst 33258 (nucleus), β-tubulin III (cytoskeleton), TGN46 (trans-Golgi network), and ATG9A (ATG9A compartment). To quantify ATG9A distribution, we calculated the ratio of ATG9A localized inside versus outside the TGN. Consistent with previous findings (9, 10, 26), AP4B1KO cells showed distinct perinuclear accumulation of ATG9A overlapping with the TGN (Figure 1, C and D), resulting in a significantly elevated ATG9A ratio (AP4B1WT, 1.276 ± 0.043; AP4B1KO, 1.817 ± 0.213; P < 0.001, Cohen’s d ≈ 2.74).
The Synthego sgRNA Human Druggable Genome library targets 8,478 genes, arrayed in a 384-well format, with designated spaces for assay-specific controls. To address potential off-target effects and transfection toxicity, we included negative controls such as AP4B1KO cells transfected with sgRNAs targeting the non-essential genes NLRP5 and KRT77, as well as untransfected AP4B1KO cells. Positive controls included AP4B1WT cells, either untransfected or transfected with sgRNAs targeting NLRP5. Additionally, AP4B1KO cells transfected with sgRNAs targeting the essential genes COPA and KIF11 served as controls to assess transfection efficiency. sgRNAs targeting ATG9A in AP4B1KO cells were used to evaluate the assay’s sensitivity to dynamic changes in ATG9A trafficking (Supplemental Figure 2A).
Each library plate was screened in 3 technical replicates with high consistency across replicates demonstrated by Pearson’s correlation coefficient (0.907 ± 0.035) (Figure 2A). Quality metrics for high-throughput screening, including Z′ and strictly standardized mean difference (SSMD) (robust versions included), exceeded predefined thresholds (Z′ and robust Z′ > 0.3; SSMD and robust SSMD > 5) (Figure 2B and Supplemental Figure 2, B–D). Knockout of non-essential genes did not alter the ATG9A ratio in either AP4B1KO or AP4B1WT cells (Figure 2C). However, minor reductions in cell count suggested low levels of toxicity from off-target effects (Figure 2D). Knockout of ATG9A similarly reduced cell counts but significantly decreased the ATG9A ratio in AP4B1KO cells, nearly matching levels observed in AP4B1WT cells. This reduction was accompanied by diminished perinuclear ATG9A accumulation (Figure 2E). As expected, knockout of essential genes induced apoptosis. For instance, sgRNAs targeting COPA reduced cell counts by approximately 52%, reflecting efficient transfection and knockout. Interestingly, KIF11 knockout decreased cell counts by only 35%, possibly owing to the reduced importance of KIF11 in postmitotic SH-SY5Y cells (Figure 2D).
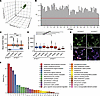 Figure 2
Quality metrics for high-throughput screen and sgRNA library. (A) Pearson’s correlation coefficients between replicates across all plates in the primary screen. High correlation between replicates demonstrated low interplate variability. Mean Pearson’s correlation coefficient: 0.907 ± 0.035. (B) Robust Z′ for all 87 screened plates confirmed reliable assay performance. Horizontal line indicates predefined quality control threshold (Z′ > 0.3). (C) ATG9A ratio for AP4B1KO and AP4B1WT cells transfected with sgRNAs targeting non-essential genes (NLRP5 and KRT77), ATG9A, and essential genes (COPA and KIF11). Red line and area represent the ATG9A ratio ± SD for untransfected AP4B1KO cells (negative control), and blue line and area represent the same for AP4B1WT cells (positive control). Statistical analysis: 1-way ANOVA, F(5) = 1,908, P < 0.001, η2 = 0.58. Tukey’s honestly significant difference post hoc test revealed significant differences between groups, ***P < 0.001. (D) Mean cell counts for AP4B1KO (red) and AP4B1WT (blue) cells, including untransfected controls (tris-EDTA [TE] buffer) and cells transfected with sgRNAs targeting non-essential (NLRP5, KRT77) and essential (COPA, KIF11) genes, as well as ATG9A. Transfection with sgRNAs targeting essential genes significantly reduced cell counts, confirming efficient transfection and gene knockout. Statistical analysis: 1-way ANOVA, F(7) = 163, P < 0.001, η2 = 0.13. Dunnett’s post hoc test identified significant group differences, ***P < 0.001. (E) Representative images of AP4B1KO/ATG9AWT (top) and AP4B1KO/ATG9AKO (bottom) SH-SY5Y cells stained for ATG9A and TGN46. Pseudocolored images depict grayscale intensity. Scale bars: 20 μm. (F) Frequency of Panther GO terms associated with genes in the Synthego Human Druggable Genome library.
Finally, analysis of the sgRNA library using PANTHER Gene Ontology (GO) terms revealed that most targeted genes encode metabolite interconversion enzymes, protein-modifying enzymes, transmembrane signal receptors, and transporters (Figure 2F).
Primary and secondary screens identify key modulators of ATG9A trafficking.
As anticipated, the majority of the 8,478 genes screened did not significantly impact ATG9A distribution, as measured by the mean robust z score of the ATG9A ratio across all 3 replicates (Figure 3, A and B). The robust z score (not to be confused with Z′) is a measure of the effect size calculated from the difference of a given value from the median in relation to the median absolute deviation. Since the screen aims for a reduction of the ATG9A ratio, the greatest negative z scores are desired.
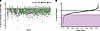 Figure 3
Primary screen identifies modulators of ATG9A trafficking. (A) Distribution of robust z scores from the primary screen. Genes are categorized as toxic (robust z score for cell count < –3 in at least 2 replicates), not toxic, or hits (not toxic and robust z score for ATG9A ratio < –3 in all replicates). A total of 92 genes were identified as hits, while 1,041 genes were classified as toxic. (B) Ranked distribution of robust z scores for all screened genes. Genes with a mean robust z score less than –3 across all replicates are highlighted. While only 92 genes met the stringent cutoff criteria of robust z scores less than –3 in all replicates and were classified as hits, 764 genes exhibited a mean robust z score less than –3 across all replicates, indicating a strong but less reproducible impact on ATG9A trafficking.
We found 1,041 genes (12.28%) that decreased the cell count (robust z score < –3 in 2 or more replicates) and excluded these genes from further analysis owing to potential cytostatic or cytotoxic effects. Ultimately, 92 genes met the predefined threshold for ATG9A ratio reduction (robust z score < –3 in all replicates), with a mean robust z score across all replicates of –4.794 ± 1.123. This represents a hit rate of 1.09%, comparable to other high-throughput screening assays (29).
To refine our findings and eliminate false positives, we conducted a secondary screen on the 92 identified hits. An additional 58 genes were selected from the top of the list of genes meeting a slightly less stringent cutoff (ATG9A ratio: robust z score < –3 in 2 replicates, robust z score < –2 in all replicates, ranked by mean robust z score of all replicates) (Supplemental Figure 3A). In rescreening these 150 top-listed genes, we followed the same experimental protocol as in the primary screen but extended the analysis to include a multiparametric TGN morphology characterization, with the goal of identifying confounding effects on Golgi morphology that could impact the ATG9A ratio. Ultimately, 44 genes were confirmed to significantly impact ATG9A translocation: 14 genes consistently met the stringent robust z score < –3 threshold across all replicates, while the remaining 30 genes satisfied a robust z score < –2 in all replicates and < –3 in at least 2 replicates (Figure 4A).
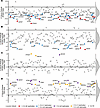 Figure 4
Secondary screen validates modulators of ATG9A trafficking. (A) Results of the secondary screen demonstrating robust z scores for the ATG9A ratio. A total of 14 genes were confirmed as hits (robust z scores < –3 in all replicates); additionally, 30 genes met the less stringent criteria of robust z scores less than –3 in 2 replicates and less than –2 in all replicates. (B) Robust z scores for ATG9A intensity inside the TGN in the secondary screen. Most hits reduced the ATG9A ratio by decreasing ATG9A intensity within the TGN. (C) Robust z scores for ATG9A intensity outside the TGN. Most genes had minimal impact on ATG9A intensity outside the TGN. (D) Robust z scores for TGN area. Several genes affected TGN morphology, as evidenced by an increase in TGN area, potentially indicating early toxicity or structural reorganization. Density distribution of robust z scores is displayed on the right in A–D.
Most identified genes reduced the ATG9A ratio by decreasing ATG9A signal intensity inside the TGN, with minimal changes to ATG9A levels outside the TGN (Figure 4B). Interestingly, 3 genes — BTN2A1, EMILIN1, and MUC20 — primarily increased ATG9A signal intensity outside the TGN (Figure 4C). Additionally, several genes were found to enlarge the TGN area, potentially indicating either a reorganization of the TGN or early signs of cytotoxicity (Figure 4D). The exact biological significance of this TGN enlargement remains unclear and warrants further investigation.
The data from primary and secondary screens are provided as supplemental files (Supplemental Files 1 and 2), offering a comprehensive resource for exploring the genetic modulators of ATG9A trafficking.
Pathway analysis illustrates modulatory landscape of ATG9A trafficking.
Hit identification in high-throughput screens based solely on ranked readout measures often overlooks the cumulative effects of functionally related genes that do not individually meet hit criteria. To address this limitation, we developed a customized pathway analysis specifically for arrayed high-throughput screens. Unlike conventional pathway analysis tools, our method incorporates the robust z score for each gene rather than relying solely on its rank position. Inspired by an approach previously used in siRNA screens (30), we used a model that calculates the cumulative robust z score adjusted for the pathway size (pathway impact [PI] score) and determines the likelihood of obtaining a given PI score by chance (P value). This model was applied to data from our primary screen. Ultimately, 463 of 15,365 pathways (3.01%) were identified as significantly affected (Figure 5 and Supplemental File 4).
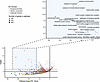 Figure 5
Pathway analysis reveals the modulatory landscape of ATG9A trafficking. Pathway analysis of primary screen results. Each dot represents a GO term. Pathway impact (PI) score reflects the cumulative robust z score of all genes associated with the respective GO term adjusted for its size. Dot size corresponds to number of genes linked to the GO term; color indicates Gene Ontology branch. Detailed view of significant pathways with PI scores between –35 and –12.5 is shown on the right, with selected pathways labeled for clarity.
To better understand these pathways, we grouped functionally similar pathways into broader clusters by calculating genetic overlaps and constructing a similarity matrix. After average-linkage clustering, we applied the Dynamic Tree Cut algorithm — commonly used in gene expression analysis within the weighted correlation network analysis (WGCNA) package (31, 32) — resulting in 12 distinct clusters (Figure 6A). Each cluster was manually annotated with umbrella terms reflecting its primary function (Table 1). For each cluster, we calculated the mean PI score and mean z score (≙ mean P value) (Figure 6, B and C). Cluster 4, encompassing GO terms related to potassium channel activity, exhibited the lowest mean z score and the highest mean PI score, indicating a substantial impact on ATG9A trafficking. Cluster 1, associated with oxidative degradation, also strongly influenced ATG9A distribution. Notably, cluster 6, comprising GO terms related to vesicular transport, demonstrated significant effects on ATG9A redistribution. Conversely, cluster 11 contained 99 pathways with no meaningful connections and was excluded from further analysis.
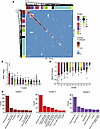 Figure 6
Pathway clustering defines regulatory pathways of ATG9A trafficking. (A) Heatmap of genetic overlap between GO terms sorted by average-linkage clustering. Overlap coefficients range from 0 (no genetic overlap) to 1 (complete genetic overlap of the smaller GO term with the larger GO term). Color bars on heatmap edges indicate clusters identified with the Dynamic Tree Cut algorithm. (B) Mean P values and SD across pathways associated with identified clusters, highlighting their statistical significance. (C) Mean PI scores and SD across pathways associated with identified clusters, indicating cumulative impact of genes on ATG9A trafficking within each cluster. (D) Protein families and number of proteins from each family associated with top 3 clusters: cluster 1 (oxidative degradation, 192 proteins), cluster 4 (potassium channel activity, 133 proteins), and cluster 6 (vesicular transport, 308 proteins).
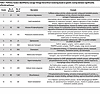 Table 1
Pathway clusters identified by average-linkage hierarchical clustering based on genetic overlap between significantly affected pathways
To characterize protein families driving these effects, we grouped proteins within the 3 most prominent clusters (lowest PI score) based on their UniProt family annotations. Cluster 1 (oxidative degradation) predominantly featured proteins from the cytochrome P450 family. Cluster 4, consistently the most affected, was enriched with potassium channel family proteins, aligning with the GO terms associated with this cluster. Interestingly, cluster 6, linked to vesicular transport, included primarily members of the small GTPase superfamily, such as Rab and Arf family proteins, but also membrane fusion proteins including synaptobrevin and syntaxin family proteins (Figure 6D). This highlights the important role of small GTPases for ATG9A trafficking in AP-4–deficient cells, something that we have also identified in a previous small-molecule screen (33).
Next, we integrated the pathway analysis findings with the results of the secondary screen. Approximately one-third of the confirmed hits from the secondary screen were associated with significant pathways, spanning 8 clusters (Figure 7A). Certain genes were exclusively linked to a single pathway cluster, such as ARL5B (“vesicular transport”), ATF6B (“cellular stress response”), HEATR5B (“vesicular transport”), KCNQ4 (“potassium channel activity”), NR3C1 (“histone H3 demethylation”), NUTF2 (“vesicular transport”), TDP1 (“signal transduction”), and TNPO1 (“vesicular transport”). Others, such as ADORA1 and NPM1, were connected to multiple clusters. Given the cellular phenotypes of AP-4 deficiency syndrome, genes involved in vesicular transport (cluster 6) were of particular interest. Notably, ARL5B, HEATR5B, NPM1, NUTF2, and TNPO1 were associated with this cluster. Cluster 2 (“lipid metabolism”) was represented by ADORA1.
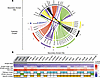 Figure 7
Selection of relevant genes for follow-up. (A) Secondary screen hits matched to significantly affected pathways and respective clusters (Supplemental File 5), identifying key modulators of ATG9A trafficking in AP-4–deficient cells. (B) Selected secondary screen hits ranked by mean ATG9A ratio reduction across all replicates in the secondary screen and meeting at least one of the following criteria: (a) association with a pathway cluster, (b) identification as an ATG9A interactor by BioID (34), and (c) availability of a specific small-molecule inhibitor. Heatmap summarizes secondary screen results.
To corroborate our findings, we compared the hits from the secondary screen with a recent study, which identified ATG9A interactors using quantitative BioID proteomics (34). Remarkably, 3 of our confirmed hits — HEATR5B, MTMR14, and SNX29 — were also present in this dataset, highlighting their potential for follow-up studies. Additionally, we evaluated the availability of specific pharmacological inhibitors for the selected genes, facilitating potential clinical translation. We narrowed the list of secondary screen hits to those meeting at least one of the following criteria: (a) association with a relevant pathway cluster, (b) identification as an ATG9A interactor by BioID (34), and (c) availability of a specific small-molecule inhibitor (Figure 7B). The top 4 hits — ANPEP, NPM1, SNX29, and KCNQ4 — were prioritized for further validation experiments.
Validation experiments confirm ANPEP and NPM1 as potential therapeutic targets.
To ensure the robustness of our findings from the primary and secondary screens, we performed validation experiments with multiple replicates (Supplemental Figure 4) based on nucleofection, a transfection method that achieves higher knockout efficiencies compared with lipofection used in the earlier screens. Knockout efficiency was confirmed via sequencing and analysis with the ICE (Inference of CRISPR Edits) tool provided by Synthego, which demonstrated knockout scores ranging from 80% to 100%. Moreover, diminished gene expression following knockout of target genes was separately confirmed on the mRNA or protein level (Supplemental Figure 5).
Reevaluation of ANPEP (also known as CD13) and NPM1 knockout confirmed their impact on the ATG9A ratio, consistent with the results from the primary and secondary screens. Conversely, knockout of KCNQ4 and SNX29 did not demonstrate a similar ATG9A translocation to that seen in both screens (Figure 8, A and B). These findings further support the role of ANPEP and NPM1 in regulating ATG9A trafficking in AP-4–deficient cells. A detailed analysis of various parameters of TGN integrity revealed less pronounced changes upon knockout of ANPEP compared with NPM1 (Figure 8C), suggesting that ANPEP plays a more specific role than NPM1 in ATG9A trafficking without fundamentally disrupting TGN structure.
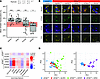 Figure 8
Validation of hits affecting ATG9A translocation. (A) Mean ATG9A translocation across up to 7 independent biological replicates after knockout of the top 4 genes (ANPEP, NPM1, KCNQ4, and SNX29) compared with knockout of the non-essential gene NLRP5 (red line and area indicate mean ± SD) in AP4B1KO cells. Statistical analysis using 1-way ANOVA revealed a significant effect of gene knockout on ATG9A translocation [F(5) = 20.48, P < 0.001, η2 = 0.27]. Dunnett’s post hoc test indicated significant differences in ATG9A translocation for AP4B1KO + ANPEP, AP4B1KO + NPM1, and AP4B1KO + SNX29 compared with AP4B1KO + NLRP5. No significant differences were observed between AP4B1KO + KCNQ4 and AP4B1KO + NLRP5. Significance level denoted as P > 0.05 (ns), *P < 0.05, and ***P < 0.001. (B) Representative fluorescence images of AP4B1WT and AP4B1KO cells following knockout of NLRP5 (negative control), ANPEP, KCNQ4, and SNX29. Images highlight differences in ATG9A localization and TGN morphology. Scale bar: 20 μm. (C) Heatmap illustrating mean z scores for cell count and 6 selected parameters describing TGN morphology. (D) Dimensionality reduction of 25 ATG9A-independent cell morphology parameters by principal component analysis (PCA) demonstrated little or no morphological difference between AP4B1WT and AP4B1KO cells. Knockout of NPM1 resulted in a pronounced deviation from controls, while knockout of ANPEP caused substantially less morphological changes.
To assess the broader effects of ANPEP and NPM1 knockouts on cell morphology, we conducted multiparametric profiling using 25 parameters characterizing the cytoskeleton (i.e., cell shape), nucleus, and TGN. Dimensionality reduction by principal component analysis across these cellular morphology metrics revealed substantial differences between the two knockouts. ANPEP knockout exhibited considerably less variability in cellular morphology compared with NPM1 knockout, underscoring the lower toxicity associated with ANPEP disruption (Figure 8D). This finding highlights ANPEP as a promising target for further therapeutic exploration, with a more favorable toxicity profile than NPM1. Raw data for validation experiments are available in Supplemental File 6.
-
Methods
For a table of key resources, please refer to Supplemental Table 1.
Sex as a biological variable
This study used SH-SY5Y cells, a cell line originally derived from a female patient. Sex itself was not considered a biological variable; we assume that the results of our study are similarly applicable to all sexes.
Experimental model and study participant details
SH-SY5Y cells. For this study, we used previously published SH-SY5Y cells stably expressing an sgRNA targeting AP4B1 and Cas9, and SH-SY5Y cells stably expressing Cas9 but no sgRNA (10). Cells were cultured in Dulbecco’s modified Eagle medium/Nutrient Mixture F-12 (Thermo Fisher Scientific) supplemented with 10% fetal bovine serum, 100 U/mL penicillin, and 100 μg/mL streptomycin. Cultures were maintained at 37°C in a humidified incubator with 5% CO2. Cells were passaged every 3 days by washing with Dulbecco’s phosphate-buffered saline (DPBS) and dissociation with 0.25% trypsin-EDTA. Changes of medium were performed every other day to ensure optimal growth conditions. For differentiation, SH-SY5Y cells were cultured in neurobasal medium supplemented with 1× B-27 supplement, 2 mM l-glutamine, and 10 μM all-trans retinoic acid for 5 days. To improve differentiation and enhance cell attachment, laminin (10 μg/mL) was added to the differentiation medium (65).
sgRNA library. The Synthego sgRNA Human Druggable Genome library was obtained from the ICCB-Longwood Screening Facility at Harvard Medical School. This library targets 8,478 human genes, using 3 distinct chemically synthesized sgRNAs per gene, each designed to target early exons. The library is arrayed across 29 plates in a 384-well format, with designated wells allocated for assay-specific controls to ensure experimental consistency.
Method details
Reverse transfection. All steps were conducted in an RNase- and DNase-free environment to ensure sample integrity. Positive and negative control sgRNAs (targeting ATG9A and NLRP5, respectively) were diluted in nuclease-free Tris-EDTA buffer and dispensed into the appropriate wells of a 384-well PCR plate to achieve a final concentration of 50 nM. Lipofectamine RNAiMAX (Thermo Fisher Scientific) transfection reagent was diluted in reduced-serum medium (Opti-MEM, Thermo Fisher Scientific) and distributed into three 384-well assay plates per library plate to create 3 replicates. The final volume of RNAiMAX in the reaction was adjusted to 0.16%. The sgRNA library and control sgRNAs were transferred to the RNAiMAX-containing assay plates using the Agilent Bravo Automated Pipettor and the Agilent 4-R BenchCel Plate Handler. SH-SY5Y cells cultured in differentiation medium for 2 days were counted using an automated cell counter. Cells were then plated at a density of 3,000 cells per well in differentiation medium containing 10 μM all-trans retinoic acid, but without laminin. The Multidrop Combi Reagent Dispenser (Thermo Fisher Scientific) was used for dispensing of RNAiMAX solution and cell plating. Plates were spun briefly to ensure even distribution of reagents and incubated at room temperature for 20 minutes to allow uniform cell settlement. The assay plates were incubated for 72 hours at 37°C in a 5% CO2 humidity-controlled incubator to minimize evaporation and edge effects. After 24 hours of incubation, 10% differentiation medium supplemented with 40 μM all-trans retinoic acid and 10 μg/mL laminin was added to support differentiation and cell adhesion.
Nucleofection. All steps were conducted in an RNase- and DNase-free environment to maintain sample integrity. To enhance gene-editing efficiency, ribonucleoprotein complexes (RNPs) were used for nucleofection. sgRNAs were diluted in tris-EDTA (TE) buffer to a stock concentration of 100 μM, and Cas9 was prepared at a stock concentration of 20 μM. The nucleofector solution was prepared by mixing of the nucleofector reagent and supplement at a 4.5:1 ratio. RNPs were assembled by combining of sgRNA (final concentration 7.2 μM) and Cas9 protein (final concentration 0.8 μM) in the nucleofector solution. Briefly, 180 pmol sgRNA was incubated with 20 pmol Cas9 protein in the nucleofector solution for at least 10 minutes to form RNP complexes. SH-SY5Y cells were harvested, and 4 × 10⁵ cells were resuspended in 5 μL of the prepared nucleofector solution. The cell suspension was mixed with the pre-assembled RNPs at a 1:6 ratio (cell suspension/RNP solution) and transferred into nucleofection strips. The strips were placed in the 4D-Nucleofector System (Lonza), and nucleofection was carried out using the CA-137 program. After nucleofection, pre-warmed medium was added to the cells after a 10-minute incubation at room temperature. The cells were subsequently plated at a density of 1 × 10⁴ cells per well into a 96-well plate using the Integra Voyager 8-channel automated pipettor.
Fixation and immunocytochemistry. After 72 hours of incubation, cells were fixed with 4% paraformaldehyde for 20 minutes at room temperature. Cells were then permeabilized using 0.1% saponin in DPBS for 10 minutes. After permeabilization, the solution was removed, and blocking buffer containing 0.1% bovine serum albumin and 0.01% saponin in DPBS was added for 20 minutes to minimize nonspecific binding. Primary antibodies were diluted in blocking buffer to the following concentrations: rabbit anti-ATG9A (1:500 to 1:1,000), sheep anti-TGN46 (1:800), and mouse anti–β-tubulin III (1:1,000). Cells were incubated with primary antibodies for 1 hour at room temperature and then washed 3 times with blocking buffer. Secondary antibodies were prepared in blocking buffer at concentrations of 1:1,250 to 1:2,000 and included Alexa Fluor 488–conjugated anti-rabbit, Alexa Fluor 594–conjugated anti-sheep, and Alexa Fluor 647–conjugated anti-mouse. Additionally, Hoechst 33258 (1:2,000) was used for nuclear staining. Cells were incubated with secondary antibodies for 30 minutes in the dark, followed by 3 washes with DPBS to remove unbound antibodies. All solutions used for immunostaining were filtered through a 0.22 μM filter system to ensure sterility and consistency. After staining, plates were sealed with opaque seals to prevent light exposure and prepared for imaging.
High-throughput imaging. High-throughput imaging in 384-well plates was performed using the Molecular Devices ImageXpress Micro Confocal Laser System, equipped with a ×40 S Plan Fluor objective (numerical aperture, 0.60 μm; working distance, 3.6–2.8 mm). For each well, 16 fields were acquired in a 4 × 4 grid configuration. For high-throughput imaging in 96-well plates, 24 sites per well were captured in a 5 × 5 grid configuration, leaving out the center position. Sites were spaced 330 μm apart to ensure even coverage of each well. A Peak Analysis & Automation GX robot arm was used for automated plate loading into the microscope. Image analysis was conducted using a customized pipeline within the MetaXpress software (version 6.7.1.157, Molecular Devices). Cells were identified as β-tubulin III–positive areas containing Hoechst-positive nuclei. The trans-Golgi network (TGN) was defined by TGN46 signal intensity, while ATG9A protein was identified based on its specific signal intensity. Overlapping TGN46 and ATG9A signals were classified as “ATG9A inside the TGN,” whereas ATG9A signal outside the TGN46-defined region but within the cellular boundary was categorized as “ATG9A outside the TGN.”
Western blotting. Cells were cultured in 6-well plates at a density of 5 × 10⁵ cells per well and harvested using RIPA buffer supplemented with protease inhibitors and phosphatase inhibitors. The total protein concentration was determined using the Pierce BCA Protein Assay Kit with absorbance measured at 562 nm using a Tecan plate reader. Protein samples were adjusted to a total amount of 15 μg, mixed with NuPAGE LDS Sample Buffer, and supplemented with NuPAGE Sample Reducing Agent (Thermo Fisher Scientific). The samples were boiled at 70°C for 10 minutes before loading onto NuPAGE 4%–12% Bis-Tris gels. Electrophoresis was carried out in NuPAGE MOPS SDS Running Buffer for approximately 50 minutes at 200 V. Proteins were transferred onto an Immobilon-FL PVDF Membrane (Millipore) using a wet transfer system with NuPAGE Transfer Buffer at 30 V for 75 minutes. The membrane was then blocked with Intercept (TBS) Blocking Buffer (LICORbio) for 60 minutes on a shaker. Membranes were incubated overnight at 4°C with the following primary antibodies, diluted in Intercept (TBS) Blocking Buffer supplemented with 0.2% Tween 20: mouse anti–CRISPR/Cas9 (1:500) (2-day incubation), rabbit anti-AP4B1 (1:500), mouse anti–β-actin (1:2,000), mouse anti-AP4E1 (1:500), and rabbit anti-ATG9A (1:500). Near-infrared secondary antibodies (IRDye 800CW donkey anti-rabbit IgG; IRDye 680LT donkey anti-mouse IgG, LICORbio) were diluted 1:5,000 in Intercept (TBS) Blocking Buffer supplemented with 0.2% Tween 20 and 0.01% sodium dodecyl sulfate. Membranes were incubated with secondary antibodies for 1 hour at room temperature in the dark. Protein detection and imaging were performed using the LI-COR Odyssey DLx system. Image analysis was carried out using Image Studio software (version 5.2.5, LI-COR).
Reverse transcription quantitative PCR. Total RNA was extracted using the RNeasy Mini Kit (QIAGEN, 74106). cDNA was synthesized using the High-Capacity cDNA Reverse Transcription Kit (Thermo Fisher Scientific, 4368813), following the manufacturer’s protocol. Quantitative PCR was performed using SYBR Green PCR Master Mix (Thermo Fisher Scientific, 4334973). Amplification was carried out on a QuantStudio 6 Flex Real-Time PCR System (Applied Biosystems) under standard cycling conditions. Melt curve analysis was included to verify product specificity.
Ct values were normalized to the mean of the housekeeping gene RPL32. Primer sequences are provided in Supplemental Table 1.
Available small-molecule inhibitors. Available small-molecule inhibitors for prioritizing secondary screen hits (Figure 4B) were identified using the International Union of Basic and Clinical Pharmacology/British Pharmacological Society Guide to Pharmacology (https://www.guidetopharmacology.org; accessed February 18, 2025) and the product portfolio of MedChemExpress (https://www.medchemexpress.com; accessed February 18, 2025).
Statistics
Statistical analysis and plotting were performed using R statistical computing (version 4.2.0) and the RStudio IDE (version 2022.12.0+353). The following R packages were used: dplyr (66), ggplot2 (67), openxlsx (68), ggpubr (69), plotly (70), ggrepel (71), ggExtra (72), janitor (73), lsr (74), tidyr (75), tibble (76), ComplexHeatmap (77, 78), multcomp (79), effectsize (80), bibtex (81), UniprotR (82), dynamicTreeCut (83), ggbreak (84), gggap (85), pbapply (86), cluster (87), purr (88), moduleColor (89), pals (90), Hmisc (91), biomaRt (92, 93), scales (94), RColorBrewer (95), and circlize (96).
For normalization, the robust z score was calculated:
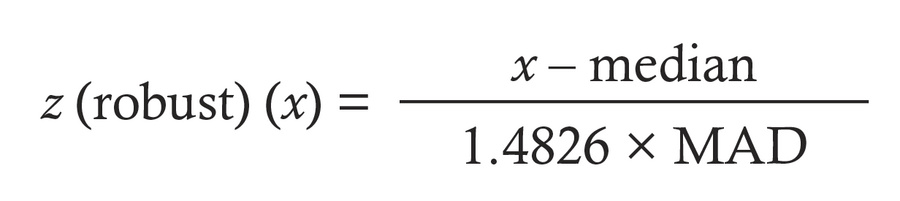 where x is value per well, “median” is median of all wells, MAD is median absolute deviation, and 1.4826 is a constant to adjust MAD for asymptomatically normal consistency.
As a quality metric for assay plates to account for plating artifacts and staining irregularities, we calculated the Z′ factor and the SSMD as well as the robust version of both parameters using the median and median absolute deviation:
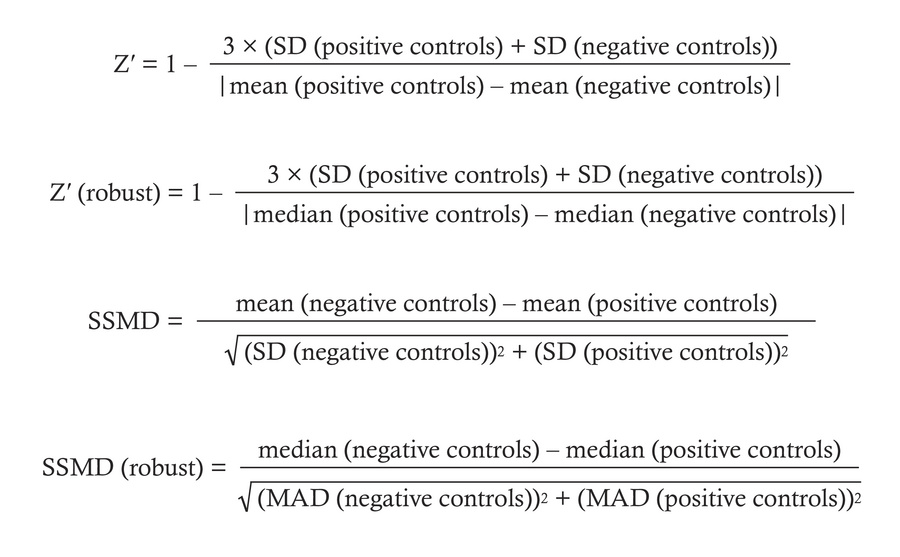
Data are shown as mean ± SD. The Pearson’s correlation coefficient was calculated between all replicates using the cor() function in R. Statistical differences between 2 groups were evaluated using 2-tailed Student’s t test, with P values less than 0.05 considered statistically significant. Effect sizes for 2-group comparisons were estimated using Cohen’s d, with the following thresholds applied: a Cohen’s d of ≤0.2 indicated a small effect, 0.5 a medium effect, and ≥0.8 a large effect (97). For comparisons involving multiple groups, 1-way ANOVA was used, followed by Tukey’s honestly significant difference or Dunnett’s multiple-comparison post hoc test for comparisons with the control group. Effect sizes for multiple-group comparisons were estimated using η2, with thresholds defined as follows: η2 ≤ 0.01 indicated a small effect, η2 = 0.06 a medium effect, and η2 ≥ 0.14 a large effect (97). A total of 3 wells in the AP4B1KO plus NLRP5 control group were excluded from analysis as a result of screening artifacts.
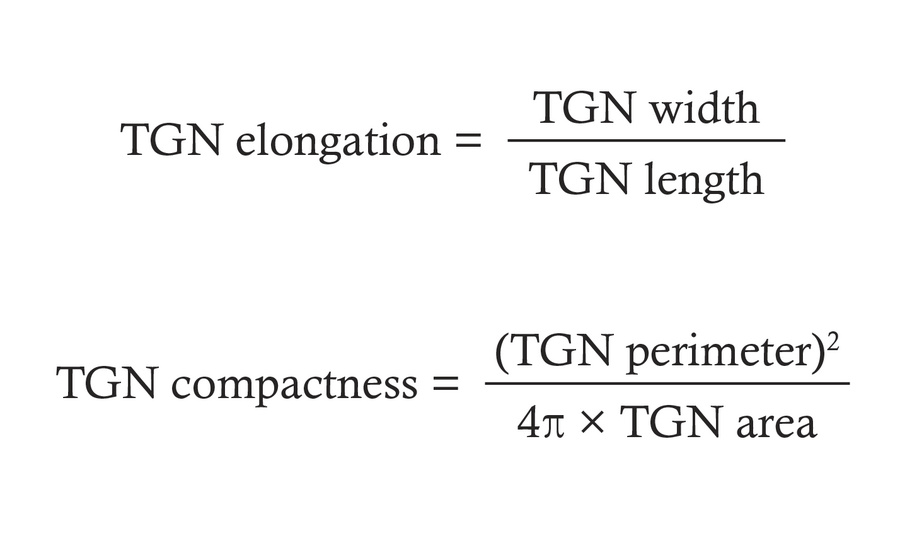
The morphological profile of the TGN was analyzed using TGN roughness (shape factor in the MetaXpress software) and the following calculated metrics:
For pathway analysis, a list of GO terms associated with genes from the screen was derived from Ensembl (Supplemental File 3). GO terms with less than 3 or more than 1,000 genes in our screen were excluded. For each GO term, a pathway impact score was calculated (30):
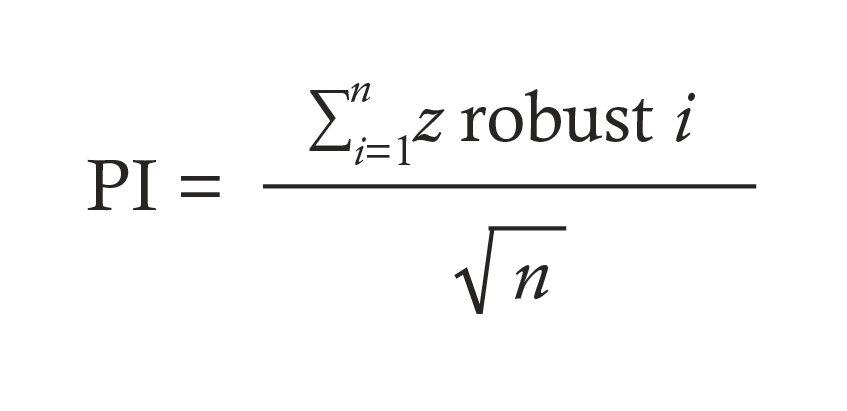 where PI is pathway impact score, n is number of genes associated with GO term, and z robust i is robust z score for each gene associated with GO term. The pathway impact (PI) score calculation for each GO term size, i.e., the number of genes comprised by each GO term, was performed 10,000 times using randomly selected values from the screen for the robust z score. From this, the normal distribution of PI scores for each GO term could be derived and the probability P of obtaining the actual PI score by chance was calculated. Similar-sized GO terms yielded a similar normal distribution. Therefore, P values were adjusted for multiple testing according to Bonferroni by multiplication by the number of occurrences of the respective GO term size. A pathway was considered significantly affected if adjusted P was less than 0.05.
To determine the overlap between 2 pathways, we calculated the overlap coefficient (30):
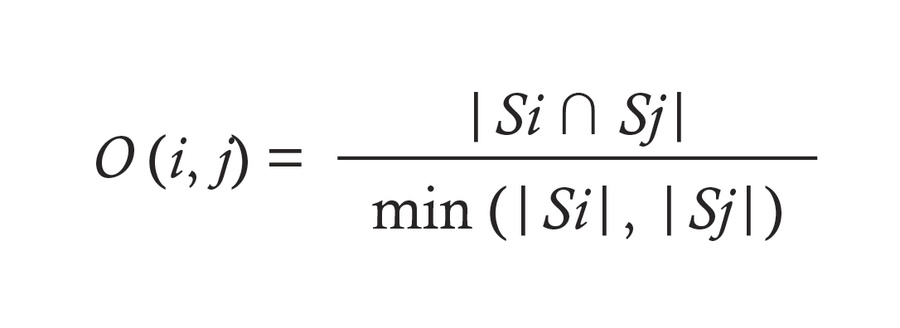 where |Si ∩ Sj| is the number of shared genes between the 2 gene sets Si and Sj, and min (|Si|, |Sj|) is the size of the smaller set.
A matrix of overlap coefficients was calculated for all pathways. From this, a distance matrix based on Euclidean distance was generated, followed by average-linkage clustering. The hierarchical clustering order was applied to reorder the overlap coefficient matrix, and a heatmap view was created for visualization. Clusters of highly overlapping pathways were identified using the Dynamic Tree Cut algorithm (83). Suitable umbrella terms were manually assigned to each cluster to provide descriptive labels. For the proteins associated with each cluster, family domain information was retrieved from the Universal Protein Resource (UniProt) (82).
Plotting and statistical analysis for Supplemental Figure 5 were performed using GraphPad Prism version 10 (GraphPad Software).
The Synthego sgRNA Human Druggable Genome library is available through the ICCB-Longwood Screening Facility at Harvard Medical School (https://iccb.med.harvard.edu/synthego-sgrna-human-druggable-genome). For the detailed nucleofection protocol for the Lonza 4D-Nucleofector, see https://bioscience.lonza.com/lonza_bs/DE/en/document/21324
Study approval
No human or animal studies were conducted.
Data availability
Screening data were deposited at Zenodo and are publicly available (doi:10.5281/zenodo.10574989). Relevant original code was deposited at Zenodo and is publicly available (doi:10.5281/zenodo.10574989). Any additional information required to reanalyze the data reported in this paper is available upon request. Source data for figures are available in the Supporting Data Values file. Requests for further information and for resources and reagents should be directed to and will be fulfilled by the corresponding author.


