
Research ArticleClinical ResearchEndocrinology
Open Access |  10.1172/jci.insight.201704
IFN-γ–producing self-reactive CD4+ T cells induce autoimmune adrenalitis in a mouse model of Addison’s disease
Arina Andreyeva,1 Juraj Michalik,1 Veronika Niederlova,1 Veronika Cimermanova,1,2 Ales Drobek,1 Radislav Sedlacek,3 Jan Prochazka,3 Juraj Labaj,3 Olha Fedosieieva,3 Waldemar Kanczkowski,4 Peter Draber,5 André Sulen,6 Ondrej Stepanek,1 and Aleš Neuwirth1
1Laboratory of Adaptive Immunity, Institute of Molecular Genetics of the Czech Academy of Sciences, Prague, Czechia.
2Faculty of Science, Charles University, Prague, Czechia.
3Czech Centre for Phenogenomics & Laboratory of Transgenic Models of Diseases, Institute of Molecular Genetics of the Czech Academy of Sciences, Vestec, Czechia.
4Department of Internal Medicine III, University Hospital Carl Gustav Carus, Technische Universität Dresden, Dresden, Germany.
5Department of Immunobiology, University of Lausanne, Epalinges, Switzerland.
6Department of Clinical Science, Faculty of Medicine, University of Bergen, Norway.
Address correspondence to: Ondrej Stepanek or Ales Neuwirth, Lab of Adaptive Immunity, Institute of Molecular Genetics, Videnska 1083, Prague 4, 142 20, Czech Republic. Phone: 420296442155; Email: ondrej.stepanek@img.cas.cz (PS). Phone: 420241062256; Email: ales.neuwirth@img.cas.cz (AN).
Find articles by Andreyeva, A. in: PubMed | Google Scholar
1Laboratory of Adaptive Immunity, Institute of Molecular Genetics of the Czech Academy of Sciences, Prague, Czechia.
2Faculty of Science, Charles University, Prague, Czechia.
3Czech Centre for Phenogenomics & Laboratory of Transgenic Models of Diseases, Institute of Molecular Genetics of the Czech Academy of Sciences, Vestec, Czechia.
4Department of Internal Medicine III, University Hospital Carl Gustav Carus, Technische Universität Dresden, Dresden, Germany.
5Department of Immunobiology, University of Lausanne, Epalinges, Switzerland.
6Department of Clinical Science, Faculty of Medicine, University of Bergen, Norway.
Address correspondence to: Ondrej Stepanek or Ales Neuwirth, Lab of Adaptive Immunity, Institute of Molecular Genetics, Videnska 1083, Prague 4, 142 20, Czech Republic. Phone: 420296442155; Email: ondrej.stepanek@img.cas.cz (PS). Phone: 420241062256; Email: ales.neuwirth@img.cas.cz (AN).
Find articles by Michalik, J. in: PubMed | Google Scholar
1Laboratory of Adaptive Immunity, Institute of Molecular Genetics of the Czech Academy of Sciences, Prague, Czechia.
2Faculty of Science, Charles University, Prague, Czechia.
3Czech Centre for Phenogenomics & Laboratory of Transgenic Models of Diseases, Institute of Molecular Genetics of the Czech Academy of Sciences, Vestec, Czechia.
4Department of Internal Medicine III, University Hospital Carl Gustav Carus, Technische Universität Dresden, Dresden, Germany.
5Department of Immunobiology, University of Lausanne, Epalinges, Switzerland.
6Department of Clinical Science, Faculty of Medicine, University of Bergen, Norway.
Address correspondence to: Ondrej Stepanek or Ales Neuwirth, Lab of Adaptive Immunity, Institute of Molecular Genetics, Videnska 1083, Prague 4, 142 20, Czech Republic. Phone: 420296442155; Email: ondrej.stepanek@img.cas.cz (PS). Phone: 420241062256; Email: ales.neuwirth@img.cas.cz (AN).
Find articles by Niederlova, V. in: PubMed | Google Scholar
1Laboratory of Adaptive Immunity, Institute of Molecular Genetics of the Czech Academy of Sciences, Prague, Czechia.
2Faculty of Science, Charles University, Prague, Czechia.
3Czech Centre for Phenogenomics & Laboratory of Transgenic Models of Diseases, Institute of Molecular Genetics of the Czech Academy of Sciences, Vestec, Czechia.
4Department of Internal Medicine III, University Hospital Carl Gustav Carus, Technische Universität Dresden, Dresden, Germany.
5Department of Immunobiology, University of Lausanne, Epalinges, Switzerland.
6Department of Clinical Science, Faculty of Medicine, University of Bergen, Norway.
Address correspondence to: Ondrej Stepanek or Ales Neuwirth, Lab of Adaptive Immunity, Institute of Molecular Genetics, Videnska 1083, Prague 4, 142 20, Czech Republic. Phone: 420296442155; Email: ondrej.stepanek@img.cas.cz (PS). Phone: 420241062256; Email: ales.neuwirth@img.cas.cz (AN).
Find articles by Cimermanova, V. in: PubMed | Google Scholar
1Laboratory of Adaptive Immunity, Institute of Molecular Genetics of the Czech Academy of Sciences, Prague, Czechia.
2Faculty of Science, Charles University, Prague, Czechia.
3Czech Centre for Phenogenomics & Laboratory of Transgenic Models of Diseases, Institute of Molecular Genetics of the Czech Academy of Sciences, Vestec, Czechia.
4Department of Internal Medicine III, University Hospital Carl Gustav Carus, Technische Universität Dresden, Dresden, Germany.
5Department of Immunobiology, University of Lausanne, Epalinges, Switzerland.
6Department of Clinical Science, Faculty of Medicine, University of Bergen, Norway.
Address correspondence to: Ondrej Stepanek or Ales Neuwirth, Lab of Adaptive Immunity, Institute of Molecular Genetics, Videnska 1083, Prague 4, 142 20, Czech Republic. Phone: 420296442155; Email: ondrej.stepanek@img.cas.cz (PS). Phone: 420241062256; Email: ales.neuwirth@img.cas.cz (AN).
Find articles by Drobek, A. in: PubMed | Google Scholar
1Laboratory of Adaptive Immunity, Institute of Molecular Genetics of the Czech Academy of Sciences, Prague, Czechia.
2Faculty of Science, Charles University, Prague, Czechia.
3Czech Centre for Phenogenomics & Laboratory of Transgenic Models of Diseases, Institute of Molecular Genetics of the Czech Academy of Sciences, Vestec, Czechia.
4Department of Internal Medicine III, University Hospital Carl Gustav Carus, Technische Universität Dresden, Dresden, Germany.
5Department of Immunobiology, University of Lausanne, Epalinges, Switzerland.
6Department of Clinical Science, Faculty of Medicine, University of Bergen, Norway.
Address correspondence to: Ondrej Stepanek or Ales Neuwirth, Lab of Adaptive Immunity, Institute of Molecular Genetics, Videnska 1083, Prague 4, 142 20, Czech Republic. Phone: 420296442155; Email: ondrej.stepanek@img.cas.cz (PS). Phone: 420241062256; Email: ales.neuwirth@img.cas.cz (AN).
Find articles by Sedlacek, R. in: PubMed | Google Scholar
1Laboratory of Adaptive Immunity, Institute of Molecular Genetics of the Czech Academy of Sciences, Prague, Czechia.
2Faculty of Science, Charles University, Prague, Czechia.
3Czech Centre for Phenogenomics & Laboratory of Transgenic Models of Diseases, Institute of Molecular Genetics of the Czech Academy of Sciences, Vestec, Czechia.
4Department of Internal Medicine III, University Hospital Carl Gustav Carus, Technische Universität Dresden, Dresden, Germany.
5Department of Immunobiology, University of Lausanne, Epalinges, Switzerland.
6Department of Clinical Science, Faculty of Medicine, University of Bergen, Norway.
Address correspondence to: Ondrej Stepanek or Ales Neuwirth, Lab of Adaptive Immunity, Institute of Molecular Genetics, Videnska 1083, Prague 4, 142 20, Czech Republic. Phone: 420296442155; Email: ondrej.stepanek@img.cas.cz (PS). Phone: 420241062256; Email: ales.neuwirth@img.cas.cz (AN).
Find articles by Prochazka, J. in: PubMed | Google Scholar
1Laboratory of Adaptive Immunity, Institute of Molecular Genetics of the Czech Academy of Sciences, Prague, Czechia.
2Faculty of Science, Charles University, Prague, Czechia.
3Czech Centre for Phenogenomics & Laboratory of Transgenic Models of Diseases, Institute of Molecular Genetics of the Czech Academy of Sciences, Vestec, Czechia.
4Department of Internal Medicine III, University Hospital Carl Gustav Carus, Technische Universität Dresden, Dresden, Germany.
5Department of Immunobiology, University of Lausanne, Epalinges, Switzerland.
6Department of Clinical Science, Faculty of Medicine, University of Bergen, Norway.
Address correspondence to: Ondrej Stepanek or Ales Neuwirth, Lab of Adaptive Immunity, Institute of Molecular Genetics, Videnska 1083, Prague 4, 142 20, Czech Republic. Phone: 420296442155; Email: ondrej.stepanek@img.cas.cz (PS). Phone: 420241062256; Email: ales.neuwirth@img.cas.cz (AN).
Find articles by Labaj, J. in: PubMed | Google Scholar
1Laboratory of Adaptive Immunity, Institute of Molecular Genetics of the Czech Academy of Sciences, Prague, Czechia.
2Faculty of Science, Charles University, Prague, Czechia.
3Czech Centre for Phenogenomics & Laboratory of Transgenic Models of Diseases, Institute of Molecular Genetics of the Czech Academy of Sciences, Vestec, Czechia.
4Department of Internal Medicine III, University Hospital Carl Gustav Carus, Technische Universität Dresden, Dresden, Germany.
5Department of Immunobiology, University of Lausanne, Epalinges, Switzerland.
6Department of Clinical Science, Faculty of Medicine, University of Bergen, Norway.
Address correspondence to: Ondrej Stepanek or Ales Neuwirth, Lab of Adaptive Immunity, Institute of Molecular Genetics, Videnska 1083, Prague 4, 142 20, Czech Republic. Phone: 420296442155; Email: ondrej.stepanek@img.cas.cz (PS). Phone: 420241062256; Email: ales.neuwirth@img.cas.cz (AN).
Find articles by Fedosieieva, O. in: PubMed | Google Scholar
1Laboratory of Adaptive Immunity, Institute of Molecular Genetics of the Czech Academy of Sciences, Prague, Czechia.
2Faculty of Science, Charles University, Prague, Czechia.
3Czech Centre for Phenogenomics & Laboratory of Transgenic Models of Diseases, Institute of Molecular Genetics of the Czech Academy of Sciences, Vestec, Czechia.
4Department of Internal Medicine III, University Hospital Carl Gustav Carus, Technische Universität Dresden, Dresden, Germany.
5Department of Immunobiology, University of Lausanne, Epalinges, Switzerland.
6Department of Clinical Science, Faculty of Medicine, University of Bergen, Norway.
Address correspondence to: Ondrej Stepanek or Ales Neuwirth, Lab of Adaptive Immunity, Institute of Molecular Genetics, Videnska 1083, Prague 4, 142 20, Czech Republic. Phone: 420296442155; Email: ondrej.stepanek@img.cas.cz (PS). Phone: 420241062256; Email: ales.neuwirth@img.cas.cz (AN).
Find articles by Kanczkowski, W. in: PubMed | Google Scholar
1Laboratory of Adaptive Immunity, Institute of Molecular Genetics of the Czech Academy of Sciences, Prague, Czechia.
2Faculty of Science, Charles University, Prague, Czechia.
3Czech Centre for Phenogenomics & Laboratory of Transgenic Models of Diseases, Institute of Molecular Genetics of the Czech Academy of Sciences, Vestec, Czechia.
4Department of Internal Medicine III, University Hospital Carl Gustav Carus, Technische Universität Dresden, Dresden, Germany.
5Department of Immunobiology, University of Lausanne, Epalinges, Switzerland.
6Department of Clinical Science, Faculty of Medicine, University of Bergen, Norway.
Address correspondence to: Ondrej Stepanek or Ales Neuwirth, Lab of Adaptive Immunity, Institute of Molecular Genetics, Videnska 1083, Prague 4, 142 20, Czech Republic. Phone: 420296442155; Email: ondrej.stepanek@img.cas.cz (PS). Phone: 420241062256; Email: ales.neuwirth@img.cas.cz (AN).
Find articles by Draber, P. in: PubMed | Google Scholar
1Laboratory of Adaptive Immunity, Institute of Molecular Genetics of the Czech Academy of Sciences, Prague, Czechia.
2Faculty of Science, Charles University, Prague, Czechia.
3Czech Centre for Phenogenomics & Laboratory of Transgenic Models of Diseases, Institute of Molecular Genetics of the Czech Academy of Sciences, Vestec, Czechia.
4Department of Internal Medicine III, University Hospital Carl Gustav Carus, Technische Universität Dresden, Dresden, Germany.
5Department of Immunobiology, University of Lausanne, Epalinges, Switzerland.
6Department of Clinical Science, Faculty of Medicine, University of Bergen, Norway.
Address correspondence to: Ondrej Stepanek or Ales Neuwirth, Lab of Adaptive Immunity, Institute of Molecular Genetics, Videnska 1083, Prague 4, 142 20, Czech Republic. Phone: 420296442155; Email: ondrej.stepanek@img.cas.cz (PS). Phone: 420241062256; Email: ales.neuwirth@img.cas.cz (AN).
Find articles by Sulen, A. in: PubMed | Google Scholar
1Laboratory of Adaptive Immunity, Institute of Molecular Genetics of the Czech Academy of Sciences, Prague, Czechia.
2Faculty of Science, Charles University, Prague, Czechia.
3Czech Centre for Phenogenomics & Laboratory of Transgenic Models of Diseases, Institute of Molecular Genetics of the Czech Academy of Sciences, Vestec, Czechia.
4Department of Internal Medicine III, University Hospital Carl Gustav Carus, Technische Universität Dresden, Dresden, Germany.
5Department of Immunobiology, University of Lausanne, Epalinges, Switzerland.
6Department of Clinical Science, Faculty of Medicine, University of Bergen, Norway.
Address correspondence to: Ondrej Stepanek or Ales Neuwirth, Lab of Adaptive Immunity, Institute of Molecular Genetics, Videnska 1083, Prague 4, 142 20, Czech Republic. Phone: 420296442155; Email: ondrej.stepanek@img.cas.cz (PS). Phone: 420241062256; Email: ales.neuwirth@img.cas.cz (AN).
Find articles by Stepanek, O. in: PubMed | Google Scholar
1Laboratory of Adaptive Immunity, Institute of Molecular Genetics of the Czech Academy of Sciences, Prague, Czechia.
2Faculty of Science, Charles University, Prague, Czechia.
3Czech Centre for Phenogenomics & Laboratory of Transgenic Models of Diseases, Institute of Molecular Genetics of the Czech Academy of Sciences, Vestec, Czechia.
4Department of Internal Medicine III, University Hospital Carl Gustav Carus, Technische Universität Dresden, Dresden, Germany.
5Department of Immunobiology, University of Lausanne, Epalinges, Switzerland.
6Department of Clinical Science, Faculty of Medicine, University of Bergen, Norway.
Address correspondence to: Ondrej Stepanek or Ales Neuwirth, Lab of Adaptive Immunity, Institute of Molecular Genetics, Videnska 1083, Prague 4, 142 20, Czech Republic. Phone: 420296442155; Email: ondrej.stepanek@img.cas.cz (PS). Phone: 420241062256; Email: ales.neuwirth@img.cas.cz (AN).
Find articles by Neuwirth, A. in: PubMed | Google Scholar
Published August 4, 2026 - More info
JCI Insight. 2026;11(18):e201704. https://doi.org/10.1172/jci.insight.201704.
© 2026 Andreyeva et al. This work is licensed under the Creative Commons Attribution 4.0 International License. To view a copy of this license, visit http://creativecommons.org/licenses/by/4.0/.
Received: October 28, 2025; Accepted: July 31, 2026


-
Results
Immunization with CYP11A1-derived peptides induces adrenal infiltration by heterogeneous CD4+ T cells. The major self-antigen in human AD is 21-OH. However, to our knowledge, no mouse models that induce an anti–21-OH immune response have been reported. Here, we sought an alternative self-antigen expressed both in adrenocortical cells and in the thymus in an AIRE-dependent manner. Our reanalysis of murine thymic single-cell RNA-Seq (scRNA-Seq) data (22) revealed that Cyp11a1 is expressed in medullary thymic epithelial cells in an AIRE-dependent manner, similar to the canonical tissue-restricted gene Ins2, whereas Cyp21a1 (encoding mouse 21-OH) expression was nearly undetectable in the thymus (Figure 1A and Supplemental Figure 1A; supplemental material available online with this article; https://doi.org/10.1172/jci.insight.201704DS1). Based on these criteria, CYP11A1, previously identified as a target of autoantibodies in patients with APS-1 (16, 18), emerged as a strong candidate autoantigen.
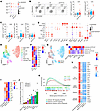 Figure 1
pCYP11A1 immunization recruits heterogeneous CD4+ T cells into the adrenals. (A) Expression of Aire, Ins2, and Cyp11a1 in thymic epithelial cells (TECs) from Aire+/+ and Aire−/− mice. Reanalysis of scRNA-Seq data from 8-week-old female mice (22). Color indicates average expression; dot size indicates the proportion of expressing cells. (B) Representative gating and quantification of adrenal CD4+ and CD8+ T cells in nontreated (NT), control (Ctr), and pCYP11A1-immunized mice at day 14 after immunization (p.i.) (3 independent experiments; n = 11–21 mice/ group). (C) Frequencies of IFN-γ+, IL17A+, and FOXP3+ adrenal CD4+ T cells after PMA/ionomycin restimulation (3 independent experiments; n = 11–21 mice/group). (B and C) Statistical significance was determined using the 2-tailed Mann-Whitney U test. Bars show mean ± SEM; symbols represent individual mice. (D–L) scRNA-Seq analysis of CD4+ T cells from adrenal and spleen of pCYP11A1-immunized and control mice at day 14 p.i. Three mice exhibiting the highest adrenal CD4+ T cell infiltration (based on flow cytometry; Supplemental Figure 2A) were selected. Control adrenals were pooled from 6 CFA-immunized mice. (D) UMAP of CD4+ T cell clusters from adrenal and spleen samples. (E) Dot plot of marker genes for cluster annotation. Data generated from adrenals. (F) Heatmap of Th1, Th1-like, and Th17 gene expression in immunized adrenals (row-normalized z scores). (G) UMAP showing tissue of origin. (H) Heatmap of CD4+ T cell cluster abundance (column-normalized z scores). (I) Heatmap of naive and activated Treg gene expression from spleen and adrenal samples (row-normalized z scores). (J) Ratio of CD4+ T cell populations in peptide-immunized versus control mice. Dashed line indicates equal frequency. Data generated from adrenals. (K) GSEA of Hallmark signatures in immunized versus control CD4+ T cells. P values were calculated by fgsea adaptive multilevel split Monte Carlo method with Benjamini-Hochberg correction. (L) Heatmap of selected genes in immunized and control spleen and adrenal (row-normalized z scores).
Using the Immune Epitope Database (23), we identified 2 CYP11A1 peptides (CYP11A1150-164 and CYP11A1233-247) predicted to bind I-Ab MHC class II molecule with the highest affinity (Supplemental Figure 1B). B6 mice were immunized with both peptides (pCYP11A1) emulsified in CFA. Two weeks after the immunization, we observed an increase in adrenal infiltration of CD4+ T cells in the immunized mice relative to CFA-only injected or nontreated controls (Figure 1B and Supplemental Figure 1C). In contrast, adrenal CD8+ T cell numbers remained comparable across all experimental groups (Figure 1B). On average, 8% of adrenal-infiltrating CD4+ T cells expressed IL17A, 6% of them produced IFN-γ, and 6% were FOXP3+ Tregs without differences between immunized and CFA-only control mice (Figure 1C and Supplemental Figure 1D). Together, these data demonstrate that pCYP11A1 immunization induces adrenal infiltration by heterogeneous CD4+ T cells.
Adrenal CD4+ T cells clonally expand and display diverse effector fates. To characterize adrenal-infiltrating CD4+ T cells, we performed scRNA-Seq combined with TCR αβ V(D)J profiling of CD4+ T cells isolated from 3 mice with high CD4+ T cell adrenal infiltration determined by flow cytometry at 2 weeks after immunization (Supplemental Figure 2A). As a control, adrenal CD4+ T cells from 6 CFA-immunized mice were pooled to obtain sufficient cell numbers (Supplemental Figure 2A). Splenic CD4+ T cells from both groups of mice were analyzed as well.
Unsupervised clustering identified 13 distinct clusters of adrenal and splenic CD4+ T cells (Supplemental Figure 2B). Five clusters represented naive CD4+ T cells and were merged into a single cluster for downstream analyses (Figure 1D). Among the Cd44+ antigen-experienced T cells (Supplemental Figure 2C), 8 clusters were annotated based on specific gene markers and/or VDJ usage: Th1 cells (Ifng+, Tbet+), Th1-like cells (Ifng+, Tbet+, Ccl5+), Th17 cells (Il17a+, Rorc+, Ccr6+), activated Tregs (aTregs) (Foxp3+, Ikzf2+, Tigit+), naive Tregs (Foxp3+, Ikzf2+), Tfh (Bcl6+, Nr4a1+, Lag3+, Pdcd1+), CD4+ invariant NKT (iNKT) cells (Nkg7+, Cd160+, CDR3α: CVVGDRGSALGRLHF), and memory T cells (Ccr7+, Tcf7+) (Figure 1E and Supplemental Figure 2, D and E). To our knowledge, the Th1-like IFN-γ–expressing cells, which differed from canonical Th1 cells by the expression of Ccl5, P2rx7, Il2, Zfp683 (Hobit), and Bcl2 and a lack of NK-related genes Ifitm1, Klrc1, and Klrd1 have not been previously described (Figure 1, E and F, and Supplemental Figure 2D).
In contrast to the spleen with predominating naive CD4+ T cells, the majority of adrenal CD4+ T cells displayed an effector phenotype (Cd44+, Icos+, Sell–, Ccr7–) (Figure 1, G and H, and Supplemental Figure 2C). In the control adrenals, CD4+ T cells were predominantly composed of iNKT cells with a limited presence of effector cells (Figure 1H).
The naive Treg cluster detected in the spleen was almost absent in the adrenals (Figure 1, G and H). Instead, adrenal Tregs exhibited an activated phenotype, as demonstrated by the changes in gene expression, including increased expression of Tigit, Lag3, Hif1a, Klrg1, Pdcd1, Id2, Ccr2, Ccr4, and Foxp3 and lower expression of Bcl2 and Il2ra (Figure 1, E and I).
Th17 and memory CD4+ T cells were enriched in all 3 immunized mice in comparison to the control sample, which comprised pooled adrenal CD4+ T cells from CFA-only treated mice (Figure 1J and Supplemental Figure 2F). Inversely, the frequencies of naive CD4+ cells and iNKT cells were higher in the control samples than in the immunized mice. Two mice showed strongly enriched Th1 cells, whereas the third one had elevated Th1-like and aTreg cells, illustrating the mouse-to-mouse variability (Figure 1J).
To complement phenotypic observations with gene-level analysis, we performed gene set enrichment analysis (GSEA) on adrenal CD4+ T cells from peptide-immunized versus control mice. This revealed enrichment of gene signatures associated with inflammatory cytokines TNF, IL-2, and IFN-γ after pCYP11A1 immunization (Figure 1K). Additionally, differential expression analysis across all experimental groups showed upregulation of proinflammatory Th1- and Th17-related genes as well as genes associated with T cell activation (Figure 1L). These transcriptional changes are consistent with the increased abundance of Th1 and Th17 effector subsets identified by scRNA-Seq.
In the next step, we identified clonally expanded families based on their shared TCRα and TCRβ sequences (Figure 2A). The clonally expanded T cells were present primarily within effector populations in the adrenal samples from all 3 pCYP11A1-immunized mice and only marginally in the spleen (Figure 2B and Supplemental Figure 2G). Th17, Th1-like, Tfh, Th1, aTreg, and memory cells were the subsets with substantial clonal expansion (Figure 2C).
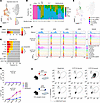 Figure 2
Adrenal CD4+ T cells are clonally expanded and include CYP11A1-reactive clones. (A) UMAP of CD4+ T cells from adrenal glands and spleens of pCYP11A1-immunized mice showing expanded T cell clones (≥2 cells sharing the same TCRαβ). (B) Distribution of expanded CD4+ T cell clones between adrenal glands and spleens. (C) Distribution of expanded CD4+ T cell clones across defined T cell subsets. Clone size was calculated separately for each subset. (A–C) Color indicates clone size (number of cells sharing the same TCRαβ). (D) Composition of the 20 largest expanded CD4+ T cell clones. Clones are arranged by effector phenotype diversity, from polarized (left) to multidirectional (right); cell numbers are indicated on the x axis. Colors indicate effector phenotype; dominant phenotypes (≥50%) are shown above. (E) UMAP highlighting 4 expanded CD4+ T cell clones (ADR1–ADR4) among effector populations. Colors indicate clone identity. (F) Representative histograms of NFAT-GFP reporter activation in A5 hybridomas expressing ADR1–ADR4 TCRs stimulated with serial dilutions of CYP11A1150-164 or CYP11A1233-247. B3K508 A5 hybridomas stimulated with 3K peptide served as a positive control, whereas peptide-free cultures and irrelevant peptides at the highest concentration served as negative controls. PMA/ionomycin served as a positive stimulation control. Colors indicate peptide concentration. Representative of 3 independent experiments. (G) Quantification of GFP+ cells corresponding to F. Data are mean ± SEM from 3 independent experiments. Colors indicate individual T cell clones. (H) Experimental design for testing antigen specificity of 2 retrogenic CD4+ T cell clones. CD69 and CD25 expression was measured after stimulation with CYP11A1150-164 or CYP11A1233-247; peptide-free cultures served as controls. Representative of 3 independent experiments. Created with BioRender.com.
Most clones exhibited a bias toward a specific lineage phenotype, with a predominance of the Th17 lineage, followed by aTreg, Tfh, and Th1-like subsets. Approximately one-third of the clones displayed a multidirectional effector phenotype. Notably, many clones with a dominant Th17 bias also gave rise to Th1 cells (Figure 2D).
To investigate antigen specificity, 4 representative clones with distinct effector profiles were selected (Figure 2E). Their TCRs were expressed in an nuclear factor of activated T cells (NFAT)-GFP reporter T cell hybridoma line (A5) (24, 25), and reactivity to pCYP11A1 was assessed using an antigen presentation assay (Figure 2, F and G, and Supplemental Figure 2H). Three clones, ADR1 (Th1/Th17), ADR3 (Tfh), and ADR4 (Treg), exhibited specificity for the CYP11A1233-247 epitope with differing levels of activation, whereas the ADR2 (Th1-like) clone did not respond to either of the pCYP11A1 peptides tested (Figure 2, F and G). Notably, ADR1 and ADR4 clones displayed strong antigen reactivity comparable to hybridoma cells expressing a control B3K508 TCR in response to its cognate exogenous 3K peptide (26, 27) (Figure 2G).
In addition, we generated retrogenic mice expressing individual TCRs. Two clones, ADR1 and ADR3, successfully gave rise to monoclonal CD4+ T cell populations in vivo. In subsequent antigen presentation assays, both ADR1- and ADR3-expressing T cells specifically responded to antigen-presenting cells loaded with CYP11A1233-247 peptide but not to CYP11A1150-164 or unloaded controls (Figure 2H), confirming antigen specificity. Notably, ADR3 exhibited lower reactivity compared with ADR1, consistent with our previous observations in A5 reporter cells.
These results demonstrate that pCYP11A1 immunization induces clonal expansion of phenotypically diverse autoreactive CD4+ T cells in the adrenal gland.
The development of the EAA model. Because adrenal CD4+ T cell infiltration was variable after a single immunization, we introduced a booster injection containing pCYP11A1, poly(I:C), and anti-CD40 antibodies (28). One week later, flow cytometry revealed enhanced adrenal infiltration by CD4+ T cells together with CD8+ T cells, B cells, and CD11b+ myeloid cells (Figure 3A and Supplemental Figure 3A). The magnitude of CD4+ T cell infiltration was comparable between male and female mice (Figure 3B). Because this protocol was more robust and reproducible, it was used in all subsequent experiments and is referred to hereafter as EAA.
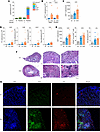 Figure 3
EAA model. (A) Quantification of total immune cells in adrenal glands of control and pCYP11A1-immunized mice (± booster) at day 25 after immunization (p.i.) (n = 5–6 mice/group). Bars show mean ± SEM; colors indicate immune cell subsets. (B) Sex-dependent quantification of adrenal CD4+ T cells at 3–4 weeks p.i. (n = 5–7 mice/group). Groups: control (Ctr) and EAA. (C and D) Quantification of adrenal CD4+ T cells and effector CD4+ T cell subsets at 3–4 weeks p.i. (E) Quantification of adrenal CD8+ T cells, IFN-γ+ CD8+ T cells, and NK cells. (C–E) Statistical significance was determined using the 2-tailed Mann-Whitney U test; P values are indicated. Bars show mean ± SEM; symbols represent individual mice (2 independent experiments; n = 9–19 mice/group). Groups: nontreated (NT), control (Ctr), and EAA. (F) Representative H&E-stained adrenal sections at 3 weeks p.i. (1 experiment; n = 4–5 mice/group). Whole-organ sections (scale bars: 200 μm) and magnified views (scale bar: 100 μm). Asterisks indicate leukocyte infiltrates. (G) Representative immunofluorescence images of adrenal sections stained for DAPI (nuclei, blue), CD45 (green), and CD4 (red) (1 experiment). Scale bar: 100 μm.
Using flow cytometry informed by the scRNA-Seq analysis (Figure 1, D and E, and Supplemental Figure 2D), we identified Th1 (IFN-γ+ CCL5–), Th1-like (IFN-γ+ CCL5+), Th17 (IL17A+), and Treg (FOXP3+) populations among adrenal CD4+ T cells after PMA/ionomycin restimulation (Supplemental Figure 3B). EAA mice exhibited increased numbers of adrenal CD4+ T cells and all analyzed effector subsets compared with controls (Figure 3, C and D, and Supplemental Figure 3C). Among these populations, only Th17 cells showed an increased relative frequency (Supplemental Figure 3C). IFN-γ+ CD8+ T cells, but not NK cells, were significantly increased in EAA mice, whereas mock immunization induced a weaker CD8+ T cell response (Figure 3E).
Histological analysis showed that leukocytes localized predominantly to the zona fasciculata, with extension toward the juxtamedullary region and medulla (Figure 3F). CD45+ and CD4+ immunofluorescence confirmed the presence of infiltrating leukocytes and T cells within the adrenal cortex (Figure 3G). This distribution resembles the pattern of adrenal infiltration reported in patients with AD (29, 30).
Overall, our data demonstrated that the EAA protocol elicits a strong immune response, characterized by specific recruitment of inflammatory cells to the adrenal cortex, which is the site of extensive steroidogenesis.
CYP11A1-driven autoimmunity induces adrenal pathology and dysfunction. We investigated whether immune cell infiltration of the adrenal gland affects its morphology and endocrine function. Because adrenal morphology and corticosterone production are sexually dimorphic (31), initial experiments were performed in male mice. Three to 5 months after EAA induction, H&E staining revealed enlarged multinucleated foamy cells (Figure 4A) with high lipid content (Figure 4B) and green autofluorescence (Figure 4C). These lipid-rich structures lacked CYP11A1 expression (Figure 4C). They were F4/80+, indicating a macrophage component (Figure 4D). These F4/80+ multinucleated lesions morphologically resembled the granulomas described in tuberculosis-associated adrenalitis (32), although their precise relationship to infectious granulomas remains unclear. Granulomas occupied approximately 2% of the adrenal cortex at 3 months and 5% at 5 months (Figure 4E).
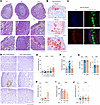 Figure 4
Long-term adrenal pathology in EAA. (A) Representative H&E-stained adrenal sections 3–5 months after immunization (p.i.) (n = 9 NT, 33–47 Ctr and EAA mice). Whole-organ sections (scale bar: 200 μm) and magnified views (scale bar: 100 μm). Adrenal borders, medulla, and multinucleated foamy cells are highlighted in yellow. (B) Representative Oil Red O staining of adrenal sections from EAA mice (1 experiment; n = 6). Scale bar: 100 μm. (C) Representative immunofluorescence of adrenal sections from EAA mice stained for DAPI (nuclei, blue) and CYP11A1 (red) (1 experiment; n = 6). Multinucleated foamy cells appear green due to lipid autofluorescence. Scale bar: 100 μm. (D) Representative F4/80 staining showing macrophage infiltration in adrenal sections from EAA mice; the right panel shows the no-primary-antibody control (1 experiment; n = 8). Middle and bottom panels show different fields of the same section. Scale bar: 100 μm. (E) Cortical granuloma frequency in B6 mice 3–4 months p.i. (4 independent experiments; n = 24–32 mice/group) and 5 months p.i. (3 independent experiments; n = 9–15 mice/group). (F) Serum corticosterone after ACTH stimulation in B6 mice 5 months p.i. (3 independent experiments; n = 16–20 mice/group). (G) Basal serum sodium and potassium in male B6 mice 5 months p.i. (2 independent experiments; n = 11–12 mice/group). (H and I) Cortical granuloma frequency and serum corticosterone after ACTH stimulation in Aire+/+, Aire−/−, and NT (Aire+/−) mice 5 months p.i. (2 independent experiments; n = 6–16 mice/group). (J) Cortical granuloma frequency in Tnfr1+/+, Tnfr1+/−, and Tnfr1−/− mice 5 months p.i. (5 independent experiments; n = 13–23 mice/group). (E–J) Statistical significance was determined using the 2-tailed Mann-Whitney U test; P values are indicated. Bars show mean ± SEM; symbols represent individual mice.
In the next step, we examined the adrenal function in the EAA mice. We measured blood corticosterone levels after adrenocorticotropic hormone (ACTH) stimulation, which is the diagnostic test for adrenal sufficiency routinely used in patients (33). EAA male mice exhibited a significant reduction in corticosterone production compared with peptide-free immunized control mice (Figure 4F). Normal blood sodium and potassium levels, along with an intact zona glomerulosa, indicated preserved mineralocorticoid production (Figure 4G). Together, these findings demonstrate that EAA induces granulomatous adrenal inflammation and corticosterone insufficiency in males.
AIRE deficiency exacerbates adrenal pathology in the EAA model. Since AIRE-dependent self-antigen expression in the thymus contributes to T cell tolerance, and CYP11A1 is absent in AIRE-deficient medullary thymic epithelial cells (22), we investigated whether Aire–/– mice would exhibit increased susceptibility to adrenal pathology in our model. Indeed, both hallmarks of EAA — granuloma formation and reduced corticosterone production — were significantly enhanced in the Aire–/– mice (Figure 4, H and I). These findings underscore the critical role of AIRE-mediated central tolerance in protecting against adrenal autoimmunity, highlighting that the absence of thymic expression of CYP11A1 increases susceptibility to autoimmune adrenal inflammation.
Next, we tested whether TNF, a proinflammatory cytokine contributing to several autoimmune and inflammatory disorders (34), is involved in EAA induction. Although TNF signaling appeared relevant in our transcriptional analyses, Tnfr1–/– mice lacking the major TNF receptor displayed similar levels of granuloma formation as TNF receptor–sufficient mice, suggesting that TNF signaling is not essential for EAA induction (Figure 4J).
CYP11A1-restimulated CD4+ T cells accelerate adrenal pathology in adoptive transfer EAA. To determine whether autoreactive CD4+ T cells are sufficient to induce disease, we adoptively transferred pCYP11A1-restimulated CD44+ CD4+ T cells into Cd3e–/– or Rag2–/– male recipients before EAA induction (Figure 5A). In both recipient strains, transferred CD4+ T cells accelerated disease, resulting in impaired corticosterone production and extensive granuloma formation 3 months after EAA induction (Figure 5, B–D). Histology and flow cytometry confirmed increased leukocyte infiltration of the zona fasciculata together with increased adrenal CD4+ T cell numbers (Figure 5, D and E). Corticosterone production showed only a mild inverse correlation with granuloma burden and CD4+ T cell infiltration (Supplemental Figure 4A).
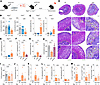 Figure 5
CD4+ T cell–derived IFN-γ drives pathology in the adoptive EAA model. (A) Adoptive EAA model design. CYP11A1-restimulated CD4+ T cells were transferred into Rag2−/− or Cd3e−/− recipients. Created with BioRender.com. (B) Serum corticosterone after ACTH stimulation in Rag2−/− (2 independent experiments; n = 9–12 mice/group) and Cd3e−/− (2 independent experiments; n = 7–8 mice/group) recipients 3 months after transfer. (C) Cortical granuloma frequency in Rag2−/− (2 independent experiments; n = 7–11 mice/group) and Cd3e−/− (2 independent experiments; n = 7–8 mice/group) recipients 3 months after transfer. (D) Representative H&E-stained adrenal sections from Rag2−/− recipients (2 independent experiments; n = 7–11 mice/group). Whole-organ sections (scale bar: 200 μm) and magnified views (scale bar: 100 μm). Adrenal borders, medulla, and granulomas are highlighted in yellow; asterisks indicate infiltrating leukocytes. (E) Quantification of adrenal CD4+ T cell infiltration in Rag2−/− recipients 3 months after transfer (2 independent experiments; n = 10–11 mice/group). (F–H) Comparison of CYP11A1 and CYP21 immunization. CD4+ T cells from pCYP11A1- or pCYP21-immunized B6 mice were restimulated with peptides and transferred into Cd3e−/− recipients (2 independent experiments; n = 5–7 mice/group; analysis at 3 months after transfer). (F) Quantification of CD4+ T cell infiltration. (G and H) Cortical granuloma frequency and serum corticosterone after ACTH stimulation. Cd3e−/− mice without transfer served as NT controls. (I–M) IFN-γ requirement in adoptive EAA. CD4+ T cells from Ifng+/+ or Ifng−/− donors were transferred into Rag2−/− recipients (2 independent experiments; n = 9–12 mice/group; analysis at 3 months after transfer). (I and J) Serum corticosterone after ACTH stimulation and cortical granuloma frequency. (K–M) CD4+ T cell infiltration and effector subset distribution. NT mice were not analyzed due to absence of T cells. (B, C, and E–M) Statistical significance was determined using the 2-tailed Mann-Whitney U test; (F–I) P values were adjusted using Bonferroni’s correction. P values are indicated. Bars show mean ± SEM; symbols represent mice.
Since CYP21 is the dominant self-antigen in AD, we investigated whether CYP21-derived peptides (pCYP21) could induce autoimmune adrenalitis in the adoptive transfer setup. Initial experiments using 2 CYP21-derived peptides (CYP21143-158, and CYP21344-359) identified CYP21344-359 as the immunogenic epitope in the peripheral response (Supplemental Figure 4, B and C). A third peptide (CYP21372-386), predicted to have the highest binding affinity for the I-Ab MHC class II molecule, was subsequently designed using the Immune Epitope Database and used with CYP21344-359 in adoptive transfer experiments. Despite its ability to induce a strong peripheral IFN-γ response, adoptive transfer of pCYP21-reactive CD4+ T cells resulted in adrenal infiltration (Figure 5F) but failed to induce granuloma formation or corticosterone insufficiency (Figure 5, G and H). Absolute numbers and frequencies of Th1, Th1-like, Th17, and Treg populations were not significantly altered after pCYP21-mediated transfer (Supplemental Figure 4D). In both conditions, IFN-γ–producing CD4+ T cells predominated, accounting for approximately 30%–40% of total CD4+ T cells (Supplemental Figure 4D). These findings demonstrate that pCYP11A1, but not pCYP21, acts as a pathogenic self-antigen in the EAA model, promoting adrenal infiltration, granuloma formation, and corticosterone insufficiency.
Together, these findings demonstrate that autoreactive CD4+ T cells are sufficient to induce EAA, whereas CD8+ T cells and B cells are dispensable.
CD4+ T cell–derived IFN-γ is required for autoimmune adrenal insufficiency. To determine the role of CD4+ T cell–derived IFN-γ, we adoptively transferred CYP11A1-restimulated Ifng–/– CD4+ T cells. Unlike WT CD4+ T cells, Ifng–/– CD4+ T cells failed to induce adrenal insufficiency: recipient mice maintained normal ACTH-stimulated corticosterone production and developed fewer adrenal granulomas (Figure 5, I and J). Flow cytometric analysis of adrenal CD4+ T cells revealed increased cellularity and a dominant Th1 phenotype after transfer of WT but not Ifng–/– CD4+ T cells (Figure 5, K–M). Together, these findings identify CD4+ T cell–derived IFN-γ as a critical mediator of autoimmune adrenal insufficiency.
Sex-dependent uncoupling of adrenal pathology and endocrine dysfunction. We examined whether the EAA model could be established in females. After 2-step immunization, females did not develop adrenal granulomas or show impaired corticosterone production (Figure 6, A–C).
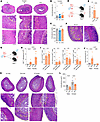 Figure 6
Sex-specific differences in EAA severity with male-restricted granuloma formation and limited functional impairment in females. (A) Representative H&E-stained adrenal sections from female B6 mice 5 months after immunization (p.i.) (2 independent experiments; n = 10–13 mice/group). Whole-organ sections (scale bar: 200 μm) and magnified views (scale bar: 100 μm). Adrenal borders, medulla, and granulomas are highlighted in yellow. (B) Cortical granuloma frequency in female B6 mice 5 months p.i. (2 independent experiments, n = 10–13 mice/group). (C) Serum corticosterone after ACTH stimulation in female B6 mice 5 months p.i. (n = 6–7 mice/group). (D) Experimental design of the adoptive EAA model. CYP11A1-restimulated CD4+ T cells from male or female donors were transferred into sex-matched Rag2−/− recipients. Created with BioRender.com. (E and F) Sex-matched adoptive transfer model; analysis at 3 months after transfer. (E) Cortical granuloma frequency in male and female Rag2−/− recipients (n = 4 mice/group). (F) Representative H&E-stained adrenal sections (scale bar: 100 μm); adrenal borders, medulla, and granulomas are highlighted in yellow. (G) Experimental design of the adoptive EAA model using male donor CD4+ T cells transferred into male or female Rag2−/− recipients. Created with BioRender.com. (H–L) Analysis of male donor CD4+ T cell transfer into male and female Rag2−/− recipients 3 months after transfer (2 independent experiments; n = 9–10 mice/group). (H and I) Quantification of CD4+ T cell infiltration and effector CD4+ T cell subsets. (J) Cortical granuloma frequency. (K) Representative H&E-stained adrenal sections. Whole-organ sections (scale bar: 200 μm) and magnified views (scale bar: 100 μm); adrenal borders, medulla, and granulomas are highlighted in yellow. (L) Serum corticosterone after ACTH stimulation. (B, C, E, H–J, and L) Statistical significance was determined using the 2-tailed Mann-Whitney U test; P values are indicated. Bars show mean ± SEM; symbols represent individual mice.
Similarly, adoptive transfer of female autoreactive T cells into female recipients failed to induce granulomas (Figure 6, D–F). To distinguish T cell–intrinsic from host-dependent effects, male T cells were transferred into male or female recipients (Figure 6G). Female recipients exhibited greater adrenal CD4+ T cell infiltration than males, with similar Th subset composition but higher absolute cell numbers (Figure 6, H and I, and Supplemental Figure 4, F and G). Despite this increased infiltration, female recipients failed to develop granulomas (Figure 6, J and K). In contrast, both male and female EAA mice exhibited reduced corticosterone production in this model (Figure 6L). These findings demonstrate a sex-dependent uncoupling of adrenal pathology and function. Whereas females were largely resistant to EAA-induced granuloma formation, they were only partially protected from EAA-induced corticosterone insufficiency. Given that the corticosterone production was higher in females than in males (Figure 6, C and L), it is possible that low corticosterone levels support granuloma formation.


