
Research ArticleHematologyOncology
Open Access |  10.1172/jci.insight.209595
Patient-derived neomorphic SEPTIN6 mutations induce hematopoietic stem cell senescence underlying congenital neutropenia and myelodysplasia
Safa F. Mohamad,1,2 Meaghan McGuinness,1 Yu Zhou,1 Xin Jiang,1,2 Gabriele Casirati,1,2,3 Adele Mucci,1,2,3 Sara Canovas Nunes,1,2 Akiko Shimamura,1,2,3 Pietro Genovese,1,2,3,4 and David A. Williams1,2,3,4
1Division of Hematology/Oncology, Boston Children’s Hospital, Boston, Massachusetts, USA.
2Department of Pediatrics, Harvard Medical School, Boston, Massachusetts, USA.
3Department of Pediatric Oncology, Dana-Farber Cancer Institute, Boston, Massachusetts, USA.
4Harvard Stem Cell Institute, Harvard University, Boston, Massachusetts, USA.
Address correspondence to: David A. Williams, 300 Longwood Avenue, Karp 8, Boston, Massachusetts, 02115, USA. Phone: 617.919.2697; Email: DAWilliams@childrens.harvard.edu.
Find articles by Mohamad, S. in: PubMed | Google Scholar
1Division of Hematology/Oncology, Boston Children’s Hospital, Boston, Massachusetts, USA.
2Department of Pediatrics, Harvard Medical School, Boston, Massachusetts, USA.
3Department of Pediatric Oncology, Dana-Farber Cancer Institute, Boston, Massachusetts, USA.
4Harvard Stem Cell Institute, Harvard University, Boston, Massachusetts, USA.
Address correspondence to: David A. Williams, 300 Longwood Avenue, Karp 8, Boston, Massachusetts, 02115, USA. Phone: 617.919.2697; Email: DAWilliams@childrens.harvard.edu.
Find articles by McGuinness, M. in: PubMed | Google Scholar
1Division of Hematology/Oncology, Boston Children’s Hospital, Boston, Massachusetts, USA.
2Department of Pediatrics, Harvard Medical School, Boston, Massachusetts, USA.
3Department of Pediatric Oncology, Dana-Farber Cancer Institute, Boston, Massachusetts, USA.
4Harvard Stem Cell Institute, Harvard University, Boston, Massachusetts, USA.
Address correspondence to: David A. Williams, 300 Longwood Avenue, Karp 8, Boston, Massachusetts, 02115, USA. Phone: 617.919.2697; Email: DAWilliams@childrens.harvard.edu.
Find articles by Zhou, Y. in: PubMed | Google Scholar
1Division of Hematology/Oncology, Boston Children’s Hospital, Boston, Massachusetts, USA.
2Department of Pediatrics, Harvard Medical School, Boston, Massachusetts, USA.
3Department of Pediatric Oncology, Dana-Farber Cancer Institute, Boston, Massachusetts, USA.
4Harvard Stem Cell Institute, Harvard University, Boston, Massachusetts, USA.
Address correspondence to: David A. Williams, 300 Longwood Avenue, Karp 8, Boston, Massachusetts, 02115, USA. Phone: 617.919.2697; Email: DAWilliams@childrens.harvard.edu.
Find articles by Jiang, X. in: PubMed | Google Scholar
1Division of Hematology/Oncology, Boston Children’s Hospital, Boston, Massachusetts, USA.
2Department of Pediatrics, Harvard Medical School, Boston, Massachusetts, USA.
3Department of Pediatric Oncology, Dana-Farber Cancer Institute, Boston, Massachusetts, USA.
4Harvard Stem Cell Institute, Harvard University, Boston, Massachusetts, USA.
Address correspondence to: David A. Williams, 300 Longwood Avenue, Karp 8, Boston, Massachusetts, 02115, USA. Phone: 617.919.2697; Email: DAWilliams@childrens.harvard.edu.
Find articles by Casirati, G. in: PubMed | Google Scholar
1Division of Hematology/Oncology, Boston Children’s Hospital, Boston, Massachusetts, USA.
2Department of Pediatrics, Harvard Medical School, Boston, Massachusetts, USA.
3Department of Pediatric Oncology, Dana-Farber Cancer Institute, Boston, Massachusetts, USA.
4Harvard Stem Cell Institute, Harvard University, Boston, Massachusetts, USA.
Address correspondence to: David A. Williams, 300 Longwood Avenue, Karp 8, Boston, Massachusetts, 02115, USA. Phone: 617.919.2697; Email: DAWilliams@childrens.harvard.edu.
Find articles by Mucci, A. in: PubMed | Google Scholar
1Division of Hematology/Oncology, Boston Children’s Hospital, Boston, Massachusetts, USA.
2Department of Pediatrics, Harvard Medical School, Boston, Massachusetts, USA.
3Department of Pediatric Oncology, Dana-Farber Cancer Institute, Boston, Massachusetts, USA.
4Harvard Stem Cell Institute, Harvard University, Boston, Massachusetts, USA.
Address correspondence to: David A. Williams, 300 Longwood Avenue, Karp 8, Boston, Massachusetts, 02115, USA. Phone: 617.919.2697; Email: DAWilliams@childrens.harvard.edu.
Find articles by Canovas Nunes, S. in: PubMed | Google Scholar
1Division of Hematology/Oncology, Boston Children’s Hospital, Boston, Massachusetts, USA.
2Department of Pediatrics, Harvard Medical School, Boston, Massachusetts, USA.
3Department of Pediatric Oncology, Dana-Farber Cancer Institute, Boston, Massachusetts, USA.
4Harvard Stem Cell Institute, Harvard University, Boston, Massachusetts, USA.
Address correspondence to: David A. Williams, 300 Longwood Avenue, Karp 8, Boston, Massachusetts, 02115, USA. Phone: 617.919.2697; Email: DAWilliams@childrens.harvard.edu.
Find articles by
Shimamura, A.
in:
PubMed
|
Google Scholar
|

1Division of Hematology/Oncology, Boston Children’s Hospital, Boston, Massachusetts, USA.
2Department of Pediatrics, Harvard Medical School, Boston, Massachusetts, USA.
3Department of Pediatric Oncology, Dana-Farber Cancer Institute, Boston, Massachusetts, USA.
4Harvard Stem Cell Institute, Harvard University, Boston, Massachusetts, USA.
Address correspondence to: David A. Williams, 300 Longwood Avenue, Karp 8, Boston, Massachusetts, 02115, USA. Phone: 617.919.2697; Email: DAWilliams@childrens.harvard.edu.
Find articles by Genovese, P. in: PubMed | Google Scholar
1Division of Hematology/Oncology, Boston Children’s Hospital, Boston, Massachusetts, USA.
2Department of Pediatrics, Harvard Medical School, Boston, Massachusetts, USA.
3Department of Pediatric Oncology, Dana-Farber Cancer Institute, Boston, Massachusetts, USA.
4Harvard Stem Cell Institute, Harvard University, Boston, Massachusetts, USA.
Address correspondence to: David A. Williams, 300 Longwood Avenue, Karp 8, Boston, Massachusetts, 02115, USA. Phone: 617.919.2697; Email: DAWilliams@childrens.harvard.edu.
Find articles by
Williams, D.
in:
PubMed
|
Google Scholar
|
Published October 22, 2026 - More info
JCI Insight. 2026;11(20):e209595. https://doi.org/10.1172/jci.insight.209595.
© 2026 Mohamad et al. This work is licensed under the Creative Commons Attribution 4.0 International License. To view a copy of this license, visit http://creativecommons.org/licenses/by/4.0/.
Received: May 28, 2026; Accepted: September 2, 2026

-
Results
Transgenic expression of GM1 in SEPT6 WT cells disrupts hematopoiesis. SEPT6 is an X-linked gene, and the reported disease phenotype manifests in males. To determine whether the phenotypes associated with these mutations resulted from reduced WT expression or, alternatively, from the acquisition of de novo protein functions, we expressed the GM1:SEPT6 c.1282T>C (p.*428Gln) mutant via LVV (Figure 1A) in WT human CD34+ cells. Human CD34+ cells were transduced and mCherry+ cells were purified 2 days after transduction by fluorescence-activated cell sorting (FACS). Following myeloid differentiation, CD34+ cells expressing GM1, but not control transduced cells, demonstrated morphological abnormalities, including cell enlargement and multinucleation (Figure 1B). Functionally, GM1 expression significantly impaired hematopoietic colony formation. Compared with controls, GM1-expressing cells produced markedly fewer granulocyte/macrophage (GM) progenitor colonies, burst-forming unit-erythroid (BFU-E) colonies, and total colonies (Figure 1C). Together, these findings indicate that GM1 expression is not only functionally defective but also exerts a negative effect on WT SEPT6, thereby disrupting hematopoiesis.
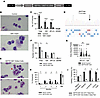 Figure 1
Transgenic expression of GM1 in CD34+ cells leads to defective hematopoiesis. (A–C) The SEPT6 c.1282T>C germline mutant (GM1) was introduced into WT human CD34+ cells. (A) Schema of the lentiviral vector (LVV) used to introduce GM1 into WT human CD34+ cells. A stuffer sequence was used as a negative open reading frame control. (B and C) Two days after transduction, mCherry+CD34+ cells were isolated. (B) Cytospins of sorted CD34+ cells cultured for 5 days showing myeloid cell morphology. Original magnification, ×100. n = 3 biological replicates with similar results. (C) Hematopoietic progenitor assays of cells plated 2 days after transduction. Colonies were counted as GM, BFU-E, or GEMM 14 days after plating. n = 3 independent experiments performed in triplicate. (D–I) Single base pair gene editing was performed to introduce GM1 into human CD34+ cells. (D) The arrow indicates the base pair edited. (E) SEPT6 GM1–edited CD34+ cells were cultured for 5 days, fixed, and stained. Original magnification, ×100. The red arrow indicates an enlarged, multinucleated cell and the black arrow indicates cytoplasmic protrusions similar to filopodia. n = 3 biological replicates with similar results. (F and G) Two hundred and fifty edited cells were plated in hematopoietic progenitor assays 2 days after electroporation. Colonies were counted after 14 days and scored by morphology (F) and colony size (G). n = 3 independent experiments performed in triplicate. (H and I) Edited CD34+ cells (1 × 10⁶) were injected retro-orbitally into NBSGW mice. (H) Chimerism was analyzed monthly in the peripheral blood (PB) and at the 4-month time point in bone marrow (BM) using flow cytometric analysis of human CD45+ (donor cells). (I) Four months after xenotransplantation, BM was sorted into myeloid, lymphoid, and CD34+ HSPC compartments. Sorted cells were sequenced to determine editing frequency. Graphs represent 2 independent xenotransplants combined. n = 7–11 mice. Data presented as mean ± SD. All experiments were analyzed using 2-tailed t tests. *P < 0.05; **P < 0.005; ****P < 0.0001.
Germline SEPT6 mutations dysregulate hematopoiesis. To confirm that hematopoietic defects seen after LVV transduction were not exclusively due to overexpression of the mutant protein, we introduced the GM1 mutation into human male CD34+ cells by adenine base editing (ABE). By electroporating an ABE mRNA and a selected gRNA, we generated a T>C substitution at the SEPT6 c.1282 codon. ABE generated an additional synonymous mutation next to the target germline mutation (Figure 1D) that does not change the protein sequence. Editing efficiency (~80%) of the target mutation was confirmed by sequencing and deconvolution analysis (TIDE) 5 days later (Figure 1D). SEPT6 GM1–edited cells were enlarged (Figure 1E) (red arrow) and displayed frequent multinucleated forms, replicating aspects of the patient’s BM cellular phenotype. Multiple cells also possessed abnormal protrusions consistent with excessive filopodia (Figure 1E) (black arrow). Functionally, SEPT6 GM1–edited CD34+ cells showed a significantly reduced total number of GM CFUs (Figure 1F), with no significant change in the number of BFU-E and granulocyte, erythrocyte, monocyte, and megakaryocyte (GEMM) CFUs. However, both GM and BFU-E colonies derived from edited cells were notably smaller (Figure 1G).
To assess hematopoietic stem cell (HSC) function, 1 × 10⁶ SEPT6 GM1– or AAVS1-edited control CD34+ cells were transplanted into NBSGW (NOD.Cg-KitW-41J Tyr + Prkdcscid Il2rgtm1Wjl/ThomJ) mice, together with a fraction of unedited (~50%) cells serving as internal competitors. SEPT6 GM1–edited cells demonstrated markedly impaired peripheral blood (PB) chimerism compared with controls at 4 months (Figure 1H). A milder but significant engraftment defect was detected in BM at the same time point (Figure 1H), suggesting impaired terminal differentiation and release into the circulation. Lineage distribution of BM at 4 months after transplantation revealed reduced contribution of edited hematopoiesis across all compartments, including myeloid (~69%), lymphoid (~80%), and HSPCs (~63%) (Figure 1I), indicating preferential reconstitution of non-edited HSPC competitors affecting all cell lineages. Together with the in vitro data, these data suggest that the SEPT6 GM1 dysregulates engraftment and differentiation at the HSPC level.
To assess the functional relevance of SEPT6 germline mutations in human hematopoiesis, we constructed an LVV enabling simultaneous knockdown of endogenous SEPT6 and re-expression of WT or mutant SEPT6 cDNAs. Because patients carry only a single X-linked SEPT6 allele, endogenous SEPT6 was silenced using a microRNA-adapted short hairpin RNA (shmiR) driven by the PGK promoter, while siRNA-resistant WT, GM1 (SEPT6 c.1282T>C, p.*428Gln), or GM2 (SEPT6 c.1282T>A, p.*428Lys) cDNAs were expressed via a minimal CMV promoter (Figure 2A). An empty vector (EV) served as control. Human CD34+ cells were transduced and GFP+ cells were purified by FACS after 7 days of culture, and efficient SEPT6 knockdown and transgene expression were confirmed by qPCR (Supplemental Figure 1A; supplemental material available online with this article; https://doi.org/10.1172/jci.insight.209595DS1) and Western blotting (Supplemental Figure 1B). Morphologically, enlarged multinucleated cells were observed specifically in the SEPT6 shmiR+GM1 group (black arrow, Figure 2B). Overall, a 2.3 ± 0.6-fold (mean ± SD) increase in multinucleation was observed in SEPT6 shmiR+GM1 compared with EV control (Figure 2C). Functionally, GM1 expression significantly reduced the total number of progenitor colonies formed, with the greatest loss in GM CFUs (Figure 2D). By contrast, re-expression of WT SEPT6 in the knockdown background fully rescued colony formation, yielding results comparable to the EV control (Figure 2D). Introduction of the second germline mutation, GM2, produced a phenotype similar to that of GM1, including multinucleated morphology (Supplemental Figure 1C) and a significant reduction in GM CFUs (Supplemental Figure 1D).
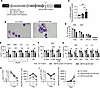 Figure 2
GM1 causes a hematopoietic engraftment defect accompanied with a decrease in the number of LT-HSCs and ST-HSCs. (A) Schema of bidirectional LVV to simultaneously knock down WT SEPT6 and express mutated SEPT6 in CD34+ cells. SEPT6 cDNAs used as inserts are shown. The location of the shmiR containing shRNA targeting WT SEPT6 embedded in microRNA30 is shown. The same schema was used to make the lentivirus used in Supplemental Figures 1, 2, and 4. (B) Photomicrographs of cytospins of CD34+ cells 7 days after transduction. Multinucleated myeloid precursor is shown at the black arrow. Original magnification, ×100. n = 3 biological replicates with similar results. (C) Cells were stained with 7-AAD to calculate percentage of multinucleation, n = 3. One-way ANOVA followed by Tukey’s multiple comparisons test as a post hoc analysis. (D) Transduced GFP+ cells were sorted and plated 2 days after transduction in hematopoietic progenitor assays. Colonies were counted 14 days after plating. n = 3 independent experiments performed in triplicate. Two-way ANOVA followed by Tukey’s multiple comparisons test as a post hoc analysis. (E–G) Transduced CD34+ cells (1 × 10⁶) 2 days after lentiviral transduction were injected retro-orbitally into NBSGW mice. (E) Percentage GFP+ donor chimerism was analyzed monthly in PB, and at the 4-month time point in BM. (F) Differences in donor engraftment in the myeloid and lymphoid compartment, and (G) immunophenotypically defined HSPC compartments analyzed in BM 4 months after xenotransplantation. (E–G) Graphs represent 1 of 2 xenotransplants, each containing an n of 5–10 mice and showing similar results. Two-way ANOVA followed by Tukey’s multiple comparisons test as a post hoc analysis. (H and I) Human CD34+ cells were transduced and flow sorted 2 days after lentiviral transduction into GFP+ cells. Transduced CD34+ cells were cultured for 10 days in serum-free culture and analyzed for immunophenotypically defined LT-HSCs (H) and ST-HSCs (I) at each time point. Both percentages (first panel) and absolute number of cells (second panel) were analyzed and calculated. n = 3. Two-way ANOVA followed by Tukey’s multiple comparisons test as a post hoc analysis. Data presented as mean ± SD (C–G) or mean ± SEM (H and I). *P < 0.05; **P < 0.005; ***P < 0.0005; ****P < 0.0001.
In xenotransplantation assays, the re-expression of WT SEPT6 rescued hematopoiesis, yielding PB chimerism and BM donor engraftment comparable to EV controls at 4 months after transplantation (Figure 2E). In contrast, GM1 expression significantly impaired engraftment. This defect was prominent in the myeloid lineage (Figure 2F), while the defect in the lymphoid compartment was less significant and variable, especially in B cells (Figure 2F), although this xenograft model does not provide robust reconstitution of lymphoid lineages. Analysis of progenitor compartments revealed a significant reduction in engrafted GFP+ HSCs, multipotent progenitors (MPPs), common myeloid progenitors (CMPs), and megakaryocyte-erythroid progenitors (MEPs) (Figure 2G). Reductions in the number of multi-lymphoid progenitors (MLPs), and lympho-myeloid primed progenitors (LMPPs) were also observed, but they were mild and not statistically significant (Figure 2G), suggesting partially lineage-restricted effects of GM1 expression.
To better define the hematopoietic defects caused by the expression of GM1, we assessed in vitro cell growth kinetics of LVV-transduced CD34+ cells. GM1 expression led to significantly reduced numbers of long-term HSCs (LT-HSCs) (Figure 2H) and short-term HSCs (ST-HSCs) (Figure 2I) over 10 days in culture. No significant differences were observed in LT-HSC and ST-HSC cell numbers between EV control and SEPT6 shmiR+WT SEPT6. Transduction of CD34+ cells with GM2 also resulted in a significant reduction in the percentage and number of LT-HSCs (Supplemental Figure 1E) and ST-HSCs (Supplemental Figure 1F) compared with controls. The reduced HSC numbers were not associated with increased apoptosis (Supplemental Figure 1G). Instead, cell cycle analysis revealed a modest but consistent increase in the percentage of G2/M cells across SEPT6 shmiR, SEPT6 shmiR+GM1, and SEPT6 shmiR+GM2 groups (Supplemental Figure 2A), suggesting that the disruption of WT SEPT6 function alters cell cycle progression rather than survival. Together, these in vivo and in vitro data demonstrate that germline SEPT6 mutations impair HSC maintenance, engraftment, and differentiation.
Dysregulation of HSPC senescence by GM1. To further investigate the mechanisms through which SEPT6 mutations disrupt hematopoiesis, we performed bulk mRNA sequencing (RNA-seq) of SEPT6 GM1–edited CD34+ cells. Principal component analysis (PCA) plots for the samples sequenced are shown in Supplemental Figure 2B. Edited cells (45%–50% efficiency) cultured for 5 days showed 220 upregulated and 110 downregulated genes relative to controls (Supplemental Figure 2C and Supplemental Table 1). Kyoto Encyclopedia of Genes and Genomes (KEGG) pathway analysis revealed broad downregulation of protein synthesis, DNA replication, and DNA damage pathways (Supplemental Figure 2D), although interpretation was limited by cellular heterogeneity within the edited populations.
We next performed single-cell RNA-seq (scRNA-seq) of purified CD34+CD45RA– progenitors after LVV transduction. Three groups were sequenced: (a) EV control, (b) SEPT6 shmiR+WT SEPT6, and (c) SEPT6 shmiR+GM1. Data from EV control and SEPT6 shmiR+WT SEPT6 groups were similar and pooled as a control set. Cell types were annotated into HSC and progenitor subsets (Supplemental Figure 3A). Among the top 10 targets, a number of genes involved in mitochondrial function were significantly downregulated in HSCs upon introduction of GM1, including mitochondrially encoded NADH:ubiquinone oxidoreductase (MTND3; –10.1 log2[fold change]), translocase of outer mitochondrial membrane 7 (TOMM7; –4.4 log2[fold change]), ATP synthase F1 subunit epsilon (ATP5F1E; –4.5 log2[fold change]), and cytochrome c oxidase subunit 7C (COX7C; –5.5 log2[fold change]) (Figure 3A). Ribosomal proteins were prominently represented, with 39 among the top 50 differentially expressed genes (DEGs) (Figure 3A and Supplemental Table 2; GM1 vs. Controls). Macrophage migration inhibitory factor (MIF), a gene that when knocked down in experimental models accelerates senescence (29), showed a log2(fold change) of –18.4 upon introduction of GM1 (Figure 3B and Supplemental Figure 3B). Although not a top target, cyclin-dependent kinase inhibitor A1 (CDKN1A/p21), another gene associated with senescence and cell cycle arrest, showed a log2(fold change) of 2 upon introduction of GM1 (Supplemental Table 2; GM1 vs. Controls). Additional downregulated transcripts included chromatin regulators such as H4 clustered histone 3 (HIST1H4C), which showed a log2(fold change) of –2.8.
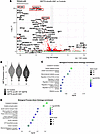 Figure 3
Transcriptional profiling of human CD34+ cells transduced with SEPT6 GM1. (A–D) Human CD34+ cells were transduced and isolated by FACS 5 days after lentiviral transduction into GFP+CD34+CD45RA– cells. Sorted cells were analyzed by scRNA-seq. (A) Volcano plots were generated to determine the differential gene expression of SEPT6 shmiR+GM1 versus EV control and SEPT6 shmiR+WT SEPT6. Red boxes denote the top target genes associated with senescence, mitochondrial, and histone regulation. The threshold was set at 0.3/–0.3 log2(fold change), n = 2 biological donors, P < 0.05. (B) Violin plots determining the differential mRNA expression of MIF through scRNA-seq. (C) Upregulated and (D) downregulated biological processes were identified and plotted through GO analysis. False discovery rate (FDR) was set at 0.05. Gene count in each pathway is represented by circle size.
Gene ontology (GO) analysis of the scRNA-seq data indicated upregulation of biological pathways involved in cellular metabolic processes, macromolecule metabolic processes, biosynthetic processes, and nitrogen compound metabolic processes (Figure 3C), and a downregulation of biological pathways mainly involved in mitochondria synthesis and mitochondrial respiration, including oxidative phosphorylation, mitochondrial ATP synthesis–coupled electron transport, proton motive force–driven mitochondrial ATP synthesis, and mitochondrial electron transport, NADH to ubiquinone (Figure 3D). In addition, pathways involved in cellular respiration were also downregulated.
Since enlarged, multinucleated morphology, dysregulated mitochondrial/translation pathways, reduced MIF expression, and increased p21 expression are features of senescence, we directly assessed the senescence of GM1-transduced progenitors. β-Galactosidase assays revealed significantly increased senescent cells on day 7 after transduction (Figure 4A), which further increased by day 15 (Figure 4B). Similar increases were observed in GM2 (Supplemental Figure 4A). GM1 also induced an approximately 2-fold upregulation of cyclin D1 at both mRNA (Figure 4C) and protein levels (Supplemental Figure 4B and Figure 4D), consistent with senescence-associated cell cycle arrest. Optic atrophy 1 (OPA-1), a mitochondrial fusion protein, demonstrated a log2(fold change) of 0.35 in mRNA expression (Supplemental Table 2; GM1 vs. Controls) and a 1.8-fold change in protein expression (Supplemental Figure 4C and Figure 4E). Mitochondrial fusion is another feature of senescence and imaging with MitoBright revealed changes in mitochondrial morphology in GM1-expressing cells compared with controls (Figure 4F). EV control– and SEPT6 shmiR+WT SEPT6–expressing cells exhibited predominantly punctate and fragmented mitochondria, while the presence of GM1 resulted in elongated tubular mitochondria with significantly reduced fragmentation (Figure 4G) consistent with enhanced mitochondrial fusion and mitochondrial network remodeling. Additionally, Seahorse analysis revealed an elevated oxygen consumption rate (OCR) in GM1-transduced HSCs (Figure 4H), confirming mitochondrial perturbations predicted by scRNA-seq.
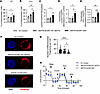 Figure 4
GM1 causes premature senescence in human CD34+ cells. (A and B) A β-galactosidase (β-gal) assay was performed on human CD34+ cells to determine the percentage of senescent cells on day 7 (D7) (A) and D15 (B) after LVV transduction. β-Gal+ cells were counted to determine percentage senescence. n = 3. (C) On D7 after lentiviral transduction, GFP+ cells were collected to quantify CyclinD1 mRNA expression. n = 3. (D) Densitometric analysis of cyclin D1 based on the Western blot shown in Supplemental Figure 4B. n = 3. (E) Densitometric analysis of OPA-1 based on the Western blot shown in Supplemental Figure 4C. n = 3. (F and G) Transduced GFP+ cells were stained with MitoBright LT Deep Red and DAPI to image for the mitochondrial network. (F) Images were acquired at ×63 oil immersion, and quantified to determine (G) the mitochondrial fragments per cell. n = 3 donors. (H) Transduced cells were sorted 5 days after LVV transduction for GFP+CD34+CD45RA–EPCR+. One day after sorting, cells were subjected to a mitochondrial stress test to determine the oxygen consumption rate (OCR) at various time points. Arrows indicate injection of various stressors: oligomycin (Oligo), carbonyl cyanite-4 (trifluoromethoxy) phenylhydrazone (FCCP), rotenone/antimycin A (R/A), and 2-deoxy-D-arabino-hexose (2DG). n = 3. Data presented as mean ± SD (A–E and G) or mean ± SEM (H). All experiments were analyzed using 1-way ANOVA followed by Tukey’s multiple comparisons test as a post hoc analysis. *P < 0.05; **P < 0.005; ***P < 0.0005; ****P < 0.0001.
Collectively, these findings indicate that SEPT6 germline mutations accelerate HSC senescence through dysregulation of mitochondrial function, protein synthesis, and chromatin regulation, providing a mechanistic basis for defective hematopoiesis and engraftment.
SM mitigates the hematopoietic defect caused by GM1. The SEPT6 c.43C>T (p.Arg15*) SM present in a low variant allele frequency (VAF) in the BM of the first patient creates a stop codon and would likely cause early truncation of the mutant protein (23) and may mitigate the deleterious effects of the germline mutant by effectively reducing expression of the C-terminal mutant. To determine the potential functional relevance of the SM present in the BM, an LVV similar to that shown in Figure 2A but with a SEPT6 cDNA containing both the GM1 and SM was constructed to efficiently introduce both mutations in cis into human CD34+ cells. Introduction of the SM in cis with GM1 led to reduced SEPT6 protein expression, similar to the SEPT6 shmiR group, as demonstrated by Western blot analysis (Figure 5A). Notably, the enlarged, multinucleated morphology observed in GM1-expressing cells was absent in the double mutant (SEPT6 shmiR+GM1+SM) (Figure 5, B and C). To directly test whether the SM rescues the proliferative defect caused by GM1, we performed competition assays in which GM1 (BFP+) and double mutant (GFP+) were cocultured at a 1:1 ratio. Over 10 days of culture, GM1-expressing cells were progressively outcompeted by cells transduced with the double mutant (Figure 5D). By day 10, 41% of cells in the GM1 group remained, whereas 59% of cells were still present in the double mutant group, supporting rescue of cell proliferation by the double mutant presumably by early truncation and reduced expression of the GM1 SEPT6 mutant protein.
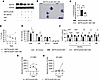 Figure 5
Rescue of the hematopoietic defect caused by GM1. (A) Western blot of sorted GFP+CD34+ cells 7 days after transduction to probe for SEPT6. GAPDH was used as a loading control. (B) Photomicrographs of cytospins of CD34+ cells 7 days after transduction. Original magnification, ×100. n = 3 biological replicates with similar results. (C) Transduced CD34+ cells were stained with 7-AAD to calculate percentage of multinucleation. n = 3. One-way ANOVA followed by Tukey’s multiple comparisons test as a post hoc analysis. (D) Transduced GFP+ SEPT6 shmiR+GM1+SM and BFP+ SEPT6 shmiR+GM1 cells were sorted and mixed in a 1:1 ratio 2 days after transduction. Mixed cells were cultured up to 10 days after transduction. Flow cytometry was used to determine percentage of GFP+ and BFP+ cells at regular intervals. n = 3. Two-tailed t test. (E) Transduced GFP+ cells were sorted and plated 2 days after transduction in hematopoietic progenitor assays. Colonies were counted 14 days after plating. n = 3 independent experiments performed in triplicate. Two-way ANOVA. (F) Transduced CD34+ cells (1 × 10⁶) 2 days after lentiviral transduction were injected retro-orbitally into NBSGW mice. Percentage GFP+ donor chimerism was analyzed monthly in PB, and at the 4-month time point in BM. Graphs represent 1 of 2 xenotransplants, each containing an n of 5–10 mice and showing similar results. Two-way ANOVA. (G and H) Human CD34+ cells were transduced and flow sorted 2 days after lentiviral transduction into GFP+ cells. Transduced CD34+cells were cultured for 10 days in serum-free culture and analyzed for immunophenotypically defined LT-HSCs (G) and ST-HSCs (H) at each time point. Controls are similar between Figure 2, H and I, and Figure 5, G and H. n = 3. Data presented as mean ± SD (C, E and F) or mean ± SEM (D, G, and H). Two-way ANOVA. *P < 0.05; **P < 0.005; ****P < 0.0001.
Colony-forming assays further supported the rescue of hematopoietic activity. GM1 expression decreased both total CFU and GM CFU numbers, while the introduction of the double mutant restored the colony output (Figure 5E). In xenotransplantation assays, as previously seen, the expression of GM1 reduced PB chimerism and BM engraftment, whereas the double mutant completely rescued this defect (Figure 5F). Donor chimerism and engraftment with the double mutant group were not significantly different from EV control. Similarly, the double mutant restored immunophenotypically defined LT-HSC (Figure 5G) and ST-HSC (Figure 5H) number in culture compared with GM1, reaching levels indistinguishable from EV control. Our data demonstrate that expression of the SM rescues the hematopoietic defects of GM1 both in vitro and in vivo.
To define the mechanisms underlying this phenotypic rescue, double mutant–transduced cells were analyzed by scRNA-seq, similarly to the studies outlined above. We analyzed GM1 HSCs versus the double mutant HSCs and both controls. Several histone and cytoskeletal accessory proteins dysregulated by GM1 were normalized by the double mutant, including HIST1H4C (–2.8 log2[fold change]) and HIST2H2AC (–1.8 log2[fold change]) (Figure 6A and Supplemental Table 2; GM1 vs. GM1+SM vs. Controls). GO analysis indicated reversal of GM1-induced defects in protein modification and mitochondrial respiration/stress pathways (Figure 6, B and C).
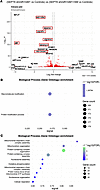 Figure 6
Transcriptional profiling of the genes rescued by the double mutant. (A–C) Human CD34+ cells were transduced and subjected to FACS 5 days after lentiviral transduction to isolate cells into GFP+CD34+CD45RA– cells. Sorted cells were analyzed by scRNA-seq. (A) Volcano plots were plotted to determine the genes uniquely expressed in SEPT6 shmiR+GM1 that were significantly different from EV control, SEPT6 shmiR+WT SEPT6, and SEPT6 shmiR+GM1+SM. Red boxes denote the top target genes associated with senescence, mitochondrial, and histone regulation. Threshold was set at 0.3/–0.3 log2(fold change), n = 2 biological donors, P < 0.05. (B) Upregulated and (C) downregulated biological processes were identified and plotted through GO analysis. FDR was set at 0.05. Gene count in each pathway is represented by circle size.
Mitochondrial genes were also prominently rescued. Among the top 10 gene targets dysregulated by GM1 but rescued by the double mutant, 6 genes were associated with mitochondria. NADH:ubiquinone oxidoreductase subunit A1 (NDUFA1) demonstrated a –2 log2(fold change) in mRNA expression; NDUFA13 a –1.9 log2(fold change), ubiquinol-cytochrome c reductase, complex III subunit XI (UQCR11) a –2.8 log2(fold change), and UQCR10 a –1.9 log2(fold change) (Figure 6A and Supplemental Table 2; GM1 vs. GM1+SM vs. Controls). Expression of MIF, a key antisenescence factor suppressed by GM1, was fully restored by the double mutant (Supplemental Figure 3B).
Functional β-galactosidase assays confirmed these transcriptomic findings. EV control (dotted line in Figure 7, A–E) and GM1 data are shown in Figure 4, A–E, and H. The double mutant significantly reduced β-galactosidase+ senescent cells compared with GM1 on day 7 after transduction (Figure 7A), with the rescue still evident on day 15 (Figure 7B). The percentage of β-galactosidase+ cells in the double mutant group was not significantly different compared to the EV control. Along with the rescue of premature senescence, double mutant cells also showed reduced mRNA expression (Figure 7C) and protein expression (Supplemental Figure 4B and Figure 7D) of cyclin D1. OPA-1 protein expression was also rescued by the double mutant (Supplemental Figure 4C and Figure 7E). To determine whether this rescue was extended to the mitochondrial dysfunction associated with GM1, we next assessed the response of the double mutant to a mitochondrial stress test. Seahorse assays showed that the double mutant restored the OCR to control-like levels, contrasting with the elevated respiration observed in GM1 cells (Figure 7F vs. Figure 4H).
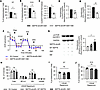 Figure 7
Rescue of premature senescence in human CD34+ cells caused by GM1. (A and B) A β-gal assay was performed on human CD34+ cells to determine the percentage of senescent cells on day 7 (D7) (A) and D15 (B) after LVV transduction. β-Gal+ cells were counted to determine percentage senescence. n = 3. Dotted line represents EV control. Controls are the same as Figure 4, A and B. (C) On D7 after lentiviral transduction, GFP+ cells were collected to quantify CyclinD1 mRNA expression. n = 3. (D and E) Western blot densitometric analysis of cyclin D1 (D) and OPA-1 (E). Blots are shown in Supplemental Figure 4, B and C, respectively. n = 3. (F) Transduced cells were sorted 5 days after LVV transduction for GFP+CD34+CD45RA–EPCR+. One day after sorting, cells were subjected to a mitochondrial stress test to determine the OCR at various time points. Arrows indicate injection of various stressors: oligomycin (Oligo), carbonyl cyanite-4 (trifluoromethoxy) phenylhydrazone (FCCP), rotenone/antimycin A (R/A), and 2-deoxy-D-arabino-hexose (2DG). Figure 4H and Figure 7F were performed during the same experimental set up. n = 3. (G) Western blot (left panel) and densitometric analysis (right panel) of phosphorylated mTOR at the Ser2481 position. GAPDH was used as an internal loading control. (H) Transduced GFP+ cells were sorted and plated 2 days after transduction in methylcellulose containing 25 nM rapamycin. Colonies were counted 14 days after plating. n = 3 independent experiments performed in triplicate. (I and J) A β-gal assay was performed on human CD34+ cells to determine the percentage of senescent cells on D7 (I) and D15 (J) after LVV transduction. Rapamycin (25 nM) was added to the culture every 7 days. β-Gal+ cells were counted to determine percentage senescence. n = 3. Data presented as mean ± SD (A–E and G–J) or mean ± SEM (F). All experiments were analyzed using 1-way ANOVA followed by Tukey’s multiple comparisons test as a post hoc analysis. *P < 0.05; **P < 0.005.
Due to association of senescence with the mTOR pathway, we analyzed changes in expression of mTOR phosphorylation. GM1 expression in human CD34+ cells resulted in the upregulation of phosphorylated mTOR at the Ser2481 position (Figure 7G). To further define mTOR pathways involved downstream of GM1, we performed rapamycin-induced mTOR inhibition. Rapamycin-induced inhibition of the mTOR pathway restored the in vitro hematopoietic defect caused by GM1 (Figure 7H). Both numbers of total and GM colonies were rescued and comparable to controls. Functional β-galactosidase assays confirmed that addition of rapamycin to transduced cells also rescued the GM1-induced senescence defect, evident on days 7 and 15 (Figure 7, I and J). These studies confirm the GM1-associated senescence defect is linked to the mTOR pathway.
Interestingly, cells transduced with SEPT6 shmiR demonstrated a modest increase in the G2/M phase of the cell cycle (Supplemental Figure 2A), although there was no significant effect on short-term hematopoietic progenitor cell production in vitro (Supplemental Figure 1D). Knockdown studies support the hypothesis that the phenotype observed due to the germline mutations are caused by the acquisition of new functions and not because of the hypomorphic expression of WT SEPT6. Despite all these broad functional and transcriptional rescues, some abnormalities persisted in cells transduced by the double mutant. Double mutant cells exhibited a modest G2/M cell cycle accumulation (Supplemental Figure 2A) and retained dysregulation of ribosomal proteins and certain metabolic pathways (Supplemental Figure 5), similarly to GM1, which suggests decreased WT SEPT6 expression may lead to subtle functional abnormalities. Overall, these data demonstrate that expression of SEPT6 SM, when present in cis with GM1, mitigates the hematopoietic, mitochondrial, and senescence defects caused by GM1. This highlights mitochondrial dysfunction and premature senescence as central mechanisms of GM1-associated hematopoietic failure.


