
Research ArticleGeneticsOphthalmology
Open Access |  10.1172/jci.insight.209108
Allotopic expression of ND6 restores vision in a mitochondrial disease model
Cheng Ai,1,2,3 Huiying Li,1,2,3 Jing Wu,1,2,3 Tianwei Zhou,1,2,3 Jing Wang,3 Shao-Hui Pan,4 Jun Yu,1,2,3 Douglas C. Wallace,5 and Min-Xin Guan1,2,3
1Center for Mitochondrial Biomedicine and Department of Ophthalmology, the Fourth Affiliated Hospital of School of Medicine, Zhejiang University, Yiwu, Zhejiang, China.
2Center for Genetic Medicine, International School of Medicine and International Institute of Medicine, and
3Institute of Genetics, Zhejiang University, Hangzhou, Zhejiang, China.
4Eye Research Center, Hangzhou Institute of Medicine, Chinese Academy of Sciences, Eye Hospital, Wenzhou Medical University, Hangzhou, China.
5Center for Mitochondrial and Epigenomic Medicine, Children’s Hospital of Philadelphia, Philadelphia, Pennsylvania, USA.
Address correspondence to: Min-Xin Guan, Institute of Genetics, Zhejiang University School of Medicine, Hangzhou, Zhejiang 310058, China. Phone: 571.88206916; Email: gminxin88@zju.edu.cn. Or to: Douglas C. Wallace, Center for Mitochondrial and Epigenomic Medicine, Children’s Hospital of Philadelphia, Philadelphia, Pennsylvania 19104-4302, USA. Phone: 267.425.3034; Email: wallaced1@email.chop.edu.
Authorship note: CA and HL contributed equally to this work.
Find articles by Ai, C. in: PubMed | Google Scholar
1Center for Mitochondrial Biomedicine and Department of Ophthalmology, the Fourth Affiliated Hospital of School of Medicine, Zhejiang University, Yiwu, Zhejiang, China.
2Center for Genetic Medicine, International School of Medicine and International Institute of Medicine, and
3Institute of Genetics, Zhejiang University, Hangzhou, Zhejiang, China.
4Eye Research Center, Hangzhou Institute of Medicine, Chinese Academy of Sciences, Eye Hospital, Wenzhou Medical University, Hangzhou, China.
5Center for Mitochondrial and Epigenomic Medicine, Children’s Hospital of Philadelphia, Philadelphia, Pennsylvania, USA.
Address correspondence to: Min-Xin Guan, Institute of Genetics, Zhejiang University School of Medicine, Hangzhou, Zhejiang 310058, China. Phone: 571.88206916; Email: gminxin88@zju.edu.cn. Or to: Douglas C. Wallace, Center for Mitochondrial and Epigenomic Medicine, Children’s Hospital of Philadelphia, Philadelphia, Pennsylvania 19104-4302, USA. Phone: 267.425.3034; Email: wallaced1@email.chop.edu.
Authorship note: CA and HL contributed equally to this work.
Find articles by
Li, H.
in:
PubMed
|
Google Scholar
|

1Center for Mitochondrial Biomedicine and Department of Ophthalmology, the Fourth Affiliated Hospital of School of Medicine, Zhejiang University, Yiwu, Zhejiang, China.
2Center for Genetic Medicine, International School of Medicine and International Institute of Medicine, and
3Institute of Genetics, Zhejiang University, Hangzhou, Zhejiang, China.
4Eye Research Center, Hangzhou Institute of Medicine, Chinese Academy of Sciences, Eye Hospital, Wenzhou Medical University, Hangzhou, China.
5Center for Mitochondrial and Epigenomic Medicine, Children’s Hospital of Philadelphia, Philadelphia, Pennsylvania, USA.
Address correspondence to: Min-Xin Guan, Institute of Genetics, Zhejiang University School of Medicine, Hangzhou, Zhejiang 310058, China. Phone: 571.88206916; Email: gminxin88@zju.edu.cn. Or to: Douglas C. Wallace, Center for Mitochondrial and Epigenomic Medicine, Children’s Hospital of Philadelphia, Philadelphia, Pennsylvania 19104-4302, USA. Phone: 267.425.3034; Email: wallaced1@email.chop.edu.
Authorship note: CA and HL contributed equally to this work.
Find articles by Wu, J. in: PubMed | Google Scholar
1Center for Mitochondrial Biomedicine and Department of Ophthalmology, the Fourth Affiliated Hospital of School of Medicine, Zhejiang University, Yiwu, Zhejiang, China.
2Center for Genetic Medicine, International School of Medicine and International Institute of Medicine, and
3Institute of Genetics, Zhejiang University, Hangzhou, Zhejiang, China.
4Eye Research Center, Hangzhou Institute of Medicine, Chinese Academy of Sciences, Eye Hospital, Wenzhou Medical University, Hangzhou, China.
5Center for Mitochondrial and Epigenomic Medicine, Children’s Hospital of Philadelphia, Philadelphia, Pennsylvania, USA.
Address correspondence to: Min-Xin Guan, Institute of Genetics, Zhejiang University School of Medicine, Hangzhou, Zhejiang 310058, China. Phone: 571.88206916; Email: gminxin88@zju.edu.cn. Or to: Douglas C. Wallace, Center for Mitochondrial and Epigenomic Medicine, Children’s Hospital of Philadelphia, Philadelphia, Pennsylvania 19104-4302, USA. Phone: 267.425.3034; Email: wallaced1@email.chop.edu.
Authorship note: CA and HL contributed equally to this work.
Find articles by Zhou, T. in: PubMed | Google Scholar
1Center for Mitochondrial Biomedicine and Department of Ophthalmology, the Fourth Affiliated Hospital of School of Medicine, Zhejiang University, Yiwu, Zhejiang, China.
2Center for Genetic Medicine, International School of Medicine and International Institute of Medicine, and
3Institute of Genetics, Zhejiang University, Hangzhou, Zhejiang, China.
4Eye Research Center, Hangzhou Institute of Medicine, Chinese Academy of Sciences, Eye Hospital, Wenzhou Medical University, Hangzhou, China.
5Center for Mitochondrial and Epigenomic Medicine, Children’s Hospital of Philadelphia, Philadelphia, Pennsylvania, USA.
Address correspondence to: Min-Xin Guan, Institute of Genetics, Zhejiang University School of Medicine, Hangzhou, Zhejiang 310058, China. Phone: 571.88206916; Email: gminxin88@zju.edu.cn. Or to: Douglas C. Wallace, Center for Mitochondrial and Epigenomic Medicine, Children’s Hospital of Philadelphia, Philadelphia, Pennsylvania 19104-4302, USA. Phone: 267.425.3034; Email: wallaced1@email.chop.edu.
Authorship note: CA and HL contributed equally to this work.
Find articles by Wang, J. in: PubMed | Google Scholar
1Center for Mitochondrial Biomedicine and Department of Ophthalmology, the Fourth Affiliated Hospital of School of Medicine, Zhejiang University, Yiwu, Zhejiang, China.
2Center for Genetic Medicine, International School of Medicine and International Institute of Medicine, and
3Institute of Genetics, Zhejiang University, Hangzhou, Zhejiang, China.
4Eye Research Center, Hangzhou Institute of Medicine, Chinese Academy of Sciences, Eye Hospital, Wenzhou Medical University, Hangzhou, China.
5Center for Mitochondrial and Epigenomic Medicine, Children’s Hospital of Philadelphia, Philadelphia, Pennsylvania, USA.
Address correspondence to: Min-Xin Guan, Institute of Genetics, Zhejiang University School of Medicine, Hangzhou, Zhejiang 310058, China. Phone: 571.88206916; Email: gminxin88@zju.edu.cn. Or to: Douglas C. Wallace, Center for Mitochondrial and Epigenomic Medicine, Children’s Hospital of Philadelphia, Philadelphia, Pennsylvania 19104-4302, USA. Phone: 267.425.3034; Email: wallaced1@email.chop.edu.
Authorship note: CA and HL contributed equally to this work.
Find articles by Pan, S. in: PubMed | Google Scholar
1Center for Mitochondrial Biomedicine and Department of Ophthalmology, the Fourth Affiliated Hospital of School of Medicine, Zhejiang University, Yiwu, Zhejiang, China.
2Center for Genetic Medicine, International School of Medicine and International Institute of Medicine, and
3Institute of Genetics, Zhejiang University, Hangzhou, Zhejiang, China.
4Eye Research Center, Hangzhou Institute of Medicine, Chinese Academy of Sciences, Eye Hospital, Wenzhou Medical University, Hangzhou, China.
5Center for Mitochondrial and Epigenomic Medicine, Children’s Hospital of Philadelphia, Philadelphia, Pennsylvania, USA.
Address correspondence to: Min-Xin Guan, Institute of Genetics, Zhejiang University School of Medicine, Hangzhou, Zhejiang 310058, China. Phone: 571.88206916; Email: gminxin88@zju.edu.cn. Or to: Douglas C. Wallace, Center for Mitochondrial and Epigenomic Medicine, Children’s Hospital of Philadelphia, Philadelphia, Pennsylvania 19104-4302, USA. Phone: 267.425.3034; Email: wallaced1@email.chop.edu.
Authorship note: CA and HL contributed equally to this work.
Find articles by Yu, J. in: PubMed | Google Scholar
1Center for Mitochondrial Biomedicine and Department of Ophthalmology, the Fourth Affiliated Hospital of School of Medicine, Zhejiang University, Yiwu, Zhejiang, China.
2Center for Genetic Medicine, International School of Medicine and International Institute of Medicine, and
3Institute of Genetics, Zhejiang University, Hangzhou, Zhejiang, China.
4Eye Research Center, Hangzhou Institute of Medicine, Chinese Academy of Sciences, Eye Hospital, Wenzhou Medical University, Hangzhou, China.
5Center for Mitochondrial and Epigenomic Medicine, Children’s Hospital of Philadelphia, Philadelphia, Pennsylvania, USA.
Address correspondence to: Min-Xin Guan, Institute of Genetics, Zhejiang University School of Medicine, Hangzhou, Zhejiang 310058, China. Phone: 571.88206916; Email: gminxin88@zju.edu.cn. Or to: Douglas C. Wallace, Center for Mitochondrial and Epigenomic Medicine, Children’s Hospital of Philadelphia, Philadelphia, Pennsylvania 19104-4302, USA. Phone: 267.425.3034; Email: wallaced1@email.chop.edu.
Authorship note: CA and HL contributed equally to this work.
Find articles by Wallace, D. in: PubMed | Google Scholar
1Center for Mitochondrial Biomedicine and Department of Ophthalmology, the Fourth Affiliated Hospital of School of Medicine, Zhejiang University, Yiwu, Zhejiang, China.
2Center for Genetic Medicine, International School of Medicine and International Institute of Medicine, and
3Institute of Genetics, Zhejiang University, Hangzhou, Zhejiang, China.
4Eye Research Center, Hangzhou Institute of Medicine, Chinese Academy of Sciences, Eye Hospital, Wenzhou Medical University, Hangzhou, China.
5Center for Mitochondrial and Epigenomic Medicine, Children’s Hospital of Philadelphia, Philadelphia, Pennsylvania, USA.
Address correspondence to: Min-Xin Guan, Institute of Genetics, Zhejiang University School of Medicine, Hangzhou, Zhejiang 310058, China. Phone: 571.88206916; Email: gminxin88@zju.edu.cn. Or to: Douglas C. Wallace, Center for Mitochondrial and Epigenomic Medicine, Children’s Hospital of Philadelphia, Philadelphia, Pennsylvania 19104-4302, USA. Phone: 267.425.3034; Email: wallaced1@email.chop.edu.
Authorship note: CA and HL contributed equally to this work.
Find articles by
Guan, M.
in:
PubMed
|
Google Scholar
|
Published September 8, 2026 - More info
JCI Insight. 2026;11(19):e209108. https://doi.org/10.1172/jci.insight.209108.
© 2026 Ai et al. This work is licensed under the Creative Commons Attribution 4.0 International License. To view a copy of this license, visit http://creativecommons.org/licenses/by/4.0/.
Received: May 13, 2026; Accepted: August 25, 2026


-
Results
Validation of AAV-mediated allotopic ND6 expression and localization in the mouse retina. We optimized the allotopic expression of human ND6 (174 amino acids) by substituting 6 non-universal codons with universal codons and making 111 additional codon changes to enhance expression efficiency (Figure 1A and Supplemental Table 1; supplemental material available online with this article; https://doi.org/10.1172/jci.insight.209108DS1). To facilitate mitochondrial targeting, we appended a 25–amino acid MTS from cytochrome c oxidase subunit 8 (COX8) to the N-terminus of the ND6 open reading frame, resulting in the construct MTS-ND6. A FLAG-tagged version of this construct (MTS-ND6-FLAG) was also generated to allow for the validation of exogenous ND6 expression and localization in retinal cells. Both the FLAG-tagged and untagged ND6 constructs were packaged into AAV2 vectors, which are known for their efficacy in transducing retinal cells (43, 44).
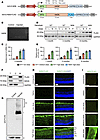 Figure 1
Expression and localization of modified ND6 in the retina. (A) Scheme for the structure of nuclear versions of human ND6. Six codons in mtDNA encoding ND6 were modified as universal codons and 111 additional codons were optimized as in Supplemental Table 1. The MTS of COX8 with 25 amino acids was added to the N-terminus of ND6. (B) Representative gel image showing the PCR product of allotopic ND6 in WT retina with or without AAV2-ND6 injection. (C) qPCR analyses of allotopic ND6 mRNA in WT and ND6P25L retinas at 3 months after injection with different doses (n = 3 mice). (D) Western blot analysis of ND6-FLAG in WT and ND6P25L retinas at 1 month, 3 months, and 6 months after injection. GAPDH was used as a loading control. (E) Quantification of ND6-FLAG in WT and ND6P25L retinas at different time points (n = 3 mice). (F) Subcellular localization of ND6-FLAG in WT retinas assessed by mitochondrial and cytosolic fractionation and Western blotting with antibodies against FLAG, SDHA as a mitochondrial marker, and GAPDH as a cytosolic marker. T, total cell lysate; C, cytosol; M, mitochondria. (G) BN-PAGE immunoblot analysis of ND6-FLAG in WT retinas. Native mitochondrial protein were separated by BN-PAGE, transferred to membranes, and immunoblotted with antibodies against FLAG and SDHC (complex II). SC, respiratory supercomplexes. (H) Immunofluorescent staining of cryosection showing retinal sections at 3 months after injection, stained for FLAG (green) and with DAPI (blue). Scale bars: 50 μm. (I) Immunofluorescent staining of cryosection showing optic nerve section at 3 months after injection stained for FLAG. Scale bar: 100 μm. GCL, ganglion cell layer; IPL, inner plexiform layer; INL, inner nuclear layer; OPL, outer plexiform layer; ONL, outer nuclear layer. Data in C and E are shown as mean ± SEM.
We evaluated the expression of ND6 in the retina following intravitreal injection of AAV2-ND6 at 3 different doses: low (5 × 10⁷ vector genomes [vg]), medium (5 × 10⁸ vg), and high (5 × 10⁹ vg) into WT mice at 2 months of age. Especially, we administered the high dose to 2-month-old ND6P25L mice. Three months after injection, the levels of exogenous ND6 were assessed using primer-specific PCR and Western blot analyses. As shown in Figure 1, B–E, robust and stable expression of exogenous ND6 was observed in both WT and ND6P25L mouse retinas following high-dose injections of AAV2-ND6 or AAV2-ND6-FLAG. However, low- and medium-dose injections yielded lower expression levels in WT retinas. To determine whether exogenous ND6 was imported into mitochondria and assembled into complex I in vivo, we performed mitochondrial fractionation and blue native PAGE (BN-PAGE) immunoblotting using retinas from AAV2-ND6-FLAG–injected WT mice. ND6-FLAG was enriched in the mitochondrial fraction and detected within native complex I, supporting its successful mitochondrial import and incorporation (Figure 1, F and G).
Immunostaining of retinal cryosections from WT mice at 3 months after injection revealed that ND6-FLAG expression was detected in the RGC layer at the low dose, in the inner plexiform layer at the medium dose, and widespread across all retinal layers at the high dose, with the strongest signal in the peripapillary retina surrounding the optic nerve head (Figure 1H and Supplemental Figure 1, A and B). Dose-dependent expression patterns were also observed in the optic nerve of WT mice at 3 months after injection, consistent with the results of Western blot analysis (Figure 1I). However, viral genome analysis showed markedly lower vector genome levels in the optic nerve than in the retina, suggesting that much of the ND6 protein detected in the optic nerve may be synthesized in transduced retinal cells and subsequently transported along their axons (Supplemental Figure 1, C and D).
To assess the safety of varying AAV2-ND6 doses, we monitored body weight and examined retinal and major organ structures (heart, liver, spleen, kidney, intestine, and muscle) using hematoxylin and eosin (H&E) staining over multiple time points (Supplemental Figure 2A). No significant differences in body weight were observed, indicating that the AAV2-ND6 injections did not induce systemic toxicity (Supplemental Figure 2B). Furthermore, histological analysis of the retina and organs revealed no pathological alterations up to 6 months after injection, regardless of the dose (Supplemental Figure 2C and Supplemental Figure 3). These results indicated that AAV2-ND6 can express exogenous ND6 efficiently in the retina and did not have obvious side effects on retinal structure or other tissues with high-dose injection.
Allotopic ND6 expression ameliorated retinal abnormalities. Our previous study showed that the ND6P25L mouse model develops optic neuropathy by 3 months of age (35). We investigated whether allotopic ND6 expression could prevent or restore retinal abnormalities associated with this condition. As outlined in the experimental timeline (Figure 2A), 2-month-old WT and ND6P25L mice were intravitreally injected with either saline or a high dose of AAV2-ND6. We assessed retinal phenotypes at baseline (2 months) and subsequently at 3, 4, and 6 months using in vivo OCT. Subsequently, retinal and mitochondrial functions were evaluated.
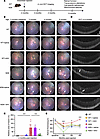 Figure 2
In vivo OCT analysis. (A) Schematic diagram of experimental procedures for the AAV-mediated allotopic ND6 intervention and pathological evaluation in WT and ND6P25L retinas. The WT and ND6P25L mice were divided into 6 groups: WT mice without injection (WT), WT mice with saline injection (WT+saline), WT mice with AAV2-ND6 injection (WT+AAV), ND6P25L mice without injection (ND6), ND6P25L mice with saline injection (ND6+saline), and ND6P25L mice with AAV2-ND6 injection (ND6+AAV). (B) Image-guided OCT analysis was performed at 2 (baseline), 3, 4, and 6 months of age. The horizontal black arrows indicate the location of the OCT scans. White arrows indicate fundus lesions. (C) Quantification of relative area of lesion in WT (n = 10 mice), WT+saline (n = 7 mice), WT+AAV (n = 6 mice), ND6 (n = 10 mice), ND6+saline (n = 3 mice) and ND6+AAV (n = 8 mice) mice. (D) Representative OCT images of mouse retinas at 6 months of age. White arrows indicate abnormalities in the photoreceptor and the retinal pigment epithelium. (E) Quantification of retinal thickness at different time points after injection in various groups (n = 7–11 mice). P values in E compare ND6 and ND6+AAV mice. Data in C and E are shown as mean ± SEM. *P < 0.05; ***P < 0.001 by 1-way ANOVA with Bonferroni’s post hoc test.
The retinal phenotype of the ND6P25L mice was further characterized. At 2 months, fundus examination revealed a normal appearance in ND6P25L mice. However, by 3 months of age, ocular lesions began to appear, and these lesions progressively enlarged at 4 and 6 months, resembling the acute phase of LHON patients (Figure 2, B and C). OCT analysis further confirmed structural abnormalities in the retinal pigment epithelium and photoreceptor layers starting from 3 months (Figure 2D and Supplemental Figure 4). Quantitative analysis revealed that retinal thickness increased progressively from 3 to 6 months of age in the ND6P25L mice (Figure 2E).
We first evaluated the therapeutic effect of the FLAG-tagged allotopic ND6. However, AAV2-ND6-FLAG did not improve the retinal phenotypes in the mutant retina and instead reduced RGC numbers in WT mice, possibly because the C-terminal FLAG interfered with the proper assembly or function of complex I (Supplemental Figure 5). We then intravitreally injected the untagged AAV2-ND6 or saline into 2-month-old ND6P25L and WT mice. After 2 and 4 months of treatment, fundus and OCT analyses showed that retinal structures in AAV2-ND6–treated ND6P25L mice were comparable to baseline (pretreatment) levels. In contrast, saline-treated ND6P25L mice exhibited severe ocular lesions (Figure 2, B–D). Quantitative analysis further demonstrated that retinal thickness in the mutant retina was similar to those of WT retinas after both 2 and 4 months of AAV2-ND6 treatment (Figure 2E). Western blot and immunofluorescent staining analyses revealed retinal inflammation in both WT and ND6P25L mice at 1 month after AAV2-ND6 injection. This inflammation was substantially attenuated at 4 months after injection (Supplemental Figure 6). Furthermore, we evaluated the therapeutic effect of AAV2-ND6 at the atrophy stage. Twelve-month-old WT and ND6P25L mice were intravitreally injected with a high dose of AAV2-ND6 and assessed at 15 months of age (Supplemental Figure 7A). However, allotopic ND6 expression did not result in appreciable recovery of fundus lesion or retinal structure abnormalities in mutant retinas at 3 months after injection (Supplemental Figure 7B). These results demonstrated that presymptomatic intervention with allotopic ND6 expression effectively attenuated disease progression in the ND6P25L mice.
Rescued retinal cell deficiency. We investigated whether allotopic ND6 expression rescued retinal cell–specific defects, including degeneration of RGCs, Müller cells, and rods, caused by the ND6P25L mutation. ND6P25L and WT mice, with or without AAV2-ND6 injection, were analyzed at 6 months of age using H&E staining and immunofluorescence assays. The H&E staining revealed that ND6P25L mice exhibited structural abnormalities in the photoreceptor layers, along with a moderate reduction in the number of RGCs and photoreceptor nuclei (Figure 3, A–C). Notably, these retinal abnormalities were substantially ameliorated in the AAV2-ND6–treated group after 4 months of intervention (Figure 3, A–C). Immunofluorescent staining analysis further showed that allotopic ND6 expression markedly mitigated retinal cell degeneration in mutant mice, bringing them closer to levels observed in WT mice (Figure 3, D–H, and Supplemental Figure 8A). Specifically, the number of Brn3a-positive RGCs (a transcription factor essential for RGC survival) and the area of Vimentin-positive Müller glia process were restored to 134% and 187% of untreated mutants, respectively (Figure 3, D–G). Furthermore, ND6 overexpression corrected the abnormal distribution of rhodopsin in ND6P25L mice (Figure 3H). No significant differences in retinal cell phenotypes were observed in WT mice, whether or not they received allotopic ND6 expression. Ultrastructural examination of the optic nerve using electron microscopy revealed axonal atrophy and demyelination in ND6P25L mice. Figure 3I shows that the optic nerve axons of ND6P25L mice exhibited severe demyelination. The average axonal density in ND6P25L mice was reduced to 80.3% of that in WT mice (Figure 3J). Quantification analysis also revealed a significant increase in the number of extremely small axonal fibers (≤0.05 μm²) in ND6P25L mice (Figure 3K and Supplemental Figure 8B). Importantly, allotopic ND6 expression substantially restored axonal structure, preserving axonal area and myelin integrity in the mutant mice (Figure 3, I–K). In contrast, allotopic ND6 expression administered at the atrophic stage did not restore degeneration of RGCs or rods in mutant retinas (Supplemental Figure 9). Together, these findings indicate that allotopic ND6 expression remarkably ameliorated retinal cellular deficiencies and optic nerve damage in ND6P25L mutant mice when applied at a presymptomatic stage.
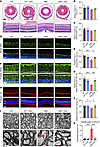 Figure 3
The recovery of retinal deficiency with allotopic ND6 expression. (A) Retinal section staining with H&E in various mice at 6 months of age. Lower panel showed the enlarged views to highlight layer alterations. The black arrow indicates an abnormality in the outer retina in ND6P25L mice without treatment. Scale bars: 500 μm (upper panel) and 50 μm (lower panel). (B and C) The number of RGCs (B) and photoceptors (C) measured from H&E staining in various mice (n = 3–4 mice). (D) Immunofluorescent staining of cryosection showing retinal section stained for Brn3a (green) for RGCs and with DAPI (blue) for nuclei. Scale bar: 50 μm. (E) Quantification of ratios of Brn3a-positive RGCs (n = 5–6 mice). (F) Immunofluorescent staining of cryosection showing retinal section stained for Vimentin for Müller glia and with DAPI. Scale bar: 50 μm. (G) Quantification of relative area of Vimentin-positive Müller glial process area (n = 4–5 mice). (H) Immunofluorescent staining of cryosection showing retinal section stained with rhodopsin (red) and DAPI. Scale bar: 100 μm. (I) Ultrastructural analysis of RGC axons in optic nerve in various mice. The red arrows indicate the demyelination of axons in ND6P25L mice. Scale bars: 2 μm (upper panel) and 1 μm (lower panel). (J and K) Quantification of axonal density (J) and percentage frequency of axon (area < 0.05 μm2) (K). n = 4 mice. Data in B, C, E, G, J, and K are shown as mean ± SEM. *P < 0.05; ***P < 0.001 by 1-way ANOVA with Bonferroni’s post hoc test. OSL, outer segment layer.
Retinal function recovery. We assessed whether allotopic ND6 expression resulted in visual function recovery after AAV2-ND6 injection for 4 months. Visual function was evaluated using full-field electroretinography (ffERG), visual evoked potentials (VEPs), and behavioral optomotor response (OMR). As shown in Figure 4, A and B, the scotopic (rod) b-wave amplitudes in ND6P25L retinas with ND6 treatment were comparable to those in WT mice across all stimulus intensities (0.01, 3, and 10 cd·s/m²). In contrast, untreated mutant retinas exhibited a significant reduction in scotopic b-wave amplitudes. Figure 4, C and D show that allotopic ND6 expression also significantly enhanced the b-wave amplitudes of photopic (cone) responses in mutant mice, reaching up to 75.4% of the WT levels, compared to only 30.5% of WT levels in untreated mutants. Moreover, allotopic ND6 expression resulted in a 179% increase in oscillatory potentials, which reflect activity in the inner plexiform layer (45) in ND6P25L mice compared with those in untreated mutant mice (Figure 4, E and F). To assess the integrity of the entire visual circuit, we performed VEP analysis. As shown in Figure 4, G and H, allotopic ND6 expression increased the N1-P1 amplitude in mutant mice to 241.6% of the untreated mutant levels, although still lower than that in WT mice. We also assessed the behavioral optomotor response by tracking the direction of rotation of the optokinetic (OKN) drum (46). As shown in Figure 4, I and J, WT mice initially exhibited an increase in OMRs followed by a decrease as spatial frequency increased, with the peak response at 0.2 Cyc/∞. In contrast, ND6P25L mice showed no change in OMRs as frequency increased, maintaining the lowest levels. Importantly, allotopic ND6 expression led to a 29.8% increase in OMRs at 0.2 Cyc/∞ in the mutant mice, compared with untreated controls (Figure 4, I and J).
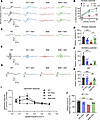 Figure 4
Visual function analysis. (A and B) Analysis of dark response in ffERG for WT, WT+AAV, ND6, and ND6+AAV mice (n = 6 mice). P values were calculated by 1-way ANOVA with Bonferroni’s post hoc test comparing ND6 and ND6+AAV mice. (C and D) Analysis of photopic response in ffERG for WT, WT+AAV, ND6, and ND6+AAV mice (n = 6 mice). (E and F) Analysis of oscillatory potential in ffERG for WT, WT+AAV, ND6, and ND6+AAV mice (n = 6 mice). (G and H) Analysis of visual evoked potentials (VEPs) for WT, WT+AAV, ND6, and ND6+AAV mice (n = 6 mice). Data are shown as mean ± SEM. (I) Analysis of optomotor response in different spatial frequency for WT, WT+AAV, ND6, and ND6+AAV mice (n = 5 mice). (J) Quantification of optomotor response in 0.2 Cyc/∞. SF, spatial frequency. Data in B, D, F, H, and J are shown as mean ± SEM. *P < 0.05; **P < 0.01; ***P < 0.001 by 1-way ANOVA with Bonferroni’s post hoc test.
Restoration of retinol metabolism and phototransduction pathways. To systematically assess how allotopic ND6 expression restored retinal cellular deficits and visual function in ND6P25L mice, we performed RNA-seq analysis on WT and mutant retinas with or without treatment at 4 months after injection. Principal component analysis (PCA) of the global data showed tight clustering of biological replicates across all 4 groups. Notably, ND6 treatment induced a marked shift in the transcriptomic profile of ND6P25L retinas, while only mild changes were observed in WT retinas after treatment (Supplemental Figure 10A). Kyoto Encyclopedia of Genes and Genomes (KEGG) pathway analysis revealed a significant downregulation of retinol metabolism in the mutant retinas compared with WT mice, which is consistent with previously reported single-cell RNA-seq (scRNA-seq) findings (Figure 5A) (35). Remarkably, retinol metabolism was substantially upregulated in ND6-treated ND6P25L retinas (Figure 5B). Both WT and ND6P25L retinas injected with AAV2-ND6 also showed enrichment in pathways related to antiviral and xenobiotic responses, such as viral protein-cytokine interactions and cytochrome P450–mediated metabolism, indicating activation of a cellular defense response to AAV delivery (Figure 5B and Supplemental Figure 10B). Gene set enrichment analysis (GSEA) further indicated that allotopic ND6 expression restored the deficient retinol metabolism and exerted only mild effects on the downregulation of phototransduction pathways in ND6P25L mutant retinas after 4 months of treatment (Figure 5, C and D). Indeed, retinol and its derivatives are critical for visual function, especially in regenerating the visual chromophore necessary for rhodopsin-mediated light reception, which triggers the phototransduction cascade to convert light into neural signals (47–49).
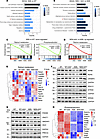 Figure 5
Transcriptome analysis of mouse retinas. (A) Bar plot showing KEGG pathway enrichment for downregulated genes in ND6 mice, as compared with WT mice. The x axis represented the number of differentially expressed genes and the color indicates q value. KEGG, Kyoto Encyclopedia of Genes and Genomes. (B) Bar plot showing KEGG pathway enrichment for upregulated genes in ND6+AAV mice, as compared with ND6 mice. The x axis represented the number of differentially expressed genes and the color indicates q value. (A and B) Red asterisks indicate the dysregulated retinol metabolism pathway. (C) Representative GSEA pathway that was significantly downregulated in ND6 mice, as compared with WT mice. GSEA, gene set enrichment analysis; NES, normalized enrichment score. (D) Representative GSEA pathways that were significantly upregulated in ND6+AAV mice, as compared with ND6 mice. (E) Heatmap displaying expression of genes involved in retinol metabolism by mean-centered log2 TPM in various mice. TPM, transcripts per kilobase million. (F) Western blot analysis of proteins involved in retinol metabolism (RARB, RDH5, RDH12, CRPBP2, STRA6, and RPE65). GAPDH was used as a loading control. (G) Western blot analysis of proteins involved in retinol metabolism (PDE6B, GNGT1, NMDAR1, RHO, and PRKCQ). GAPDH was used as a loading control. (H) Heatmap displaying expression of genes involved in phototransduction by mean-centered log2 TPM in various mice.
We further examined the effects of allotopic ND6 expression on retinol metabolism and phototransduction. RNA-seq data revealed upregulation of genes encoding retinoid dehydrogenases (Rdh5, Rdh10, and Aldh1a2) and visual cycle enzymes (Rpe65 and Lrat), along with downregulation of the retinol degradation enzyme Cyp26b1 in mutant retinas after allotopic ND6 expression (Figure 5E). Western blot analysis confirmed the upregulation of the retinol metabolism pathway, with increased levels of retinol metabolism–related components (RPE65, RDH5, RDH12, STRA6, RARB, and CRABP2) in AAV-injected ND6P25L mice (Figure 5F and Supplemental Figure 10C). Furthermore, both RNA-seq and Western blot analyses showed the upregulation of phototransduction pathways, evidenced by increased levels of phototransduction components such as RHO, PRKCQ, PDE6B, GNGT1, and NMDAR1 (Figure 5, G and H, and Supplemental Figure 10D). These findings demonstrated that allotopic ND6 expression restored retinal cell deficiencies and visual function through activating retinol metabolism and phototransduction pathways.
Rescued mitochondrial morphology and function. To determine whether AAV-mediated allotopic ND6 expression can rescue mitochondrial dysfunction caused by the ND6 P25L allele, we measured the levels of ND6, ND1, and nucleus-encoded subunits of complex I (NDUFA13 and NDUFS2) using Western blot analysis. As shown in Figure 6, A and B, allotopic ND6 expression resulted in a 133.9% increase in ND6 levels in the mutant retinas compared with untreated mutants. In contrast, no significant differences were observed in the levels of ND1, NDUFA13, or NDUFS2 between mice with or without AAV2-ND6 injection. We then assessed whether allotopic ND6 expression restored mitochondrial ultrastructure by performing transmission electron microscopy. Mitochondria in the ganglion cell layer of mutant mice were enlarged and reduced in number, whereas mitochondria in the optic nerve appeared smaller and more numerous. As shown in Figure 6, C and D, ND6 treatment significantly ameliorated these mitochondrial abnormalities, including swelling, cristae malformations, and changes in size and number in both the ganglion cell layer of retina and optic nerve. We also evaluated mitochondrial function recovery in the retina using enzyme histochemical staining for NADH dehydrogenase (complex I), succinate dehydrogenase (SDH, complex II), and cytochrome c oxidase (COX, complex IV) in frozen retinal sections. As shown in Figure 6E, ND6 expression substantially increased complex I activity and modestly elevated SDH and COX staining in the mutant retina, indicating restored mitochondrial function. Furthermore, total cellular ATP levels in the mutant retinas increased to 142% of those in untreated mutant mice (Figure 6F).
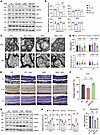 Figure 6
Mitochondrial morphology and function. (A) Western blot analysis of mitochondrial proteins with antibodies against ND6, ND1, NDUFA13, and NDUFS2, and GAPDH as a loading control. (B) Quantification of ND6, ND1, NDUFA13, and NDUFS2 in various mouse retinas. Representative of 4 independent experiments. (C) Representative transmission electron micrographs of mitochondria from the ganglion cell layer (GCL) of retinas and optic nerve (ON) in WT, WT+AAV, ND6, and ND6+AAV mice. Yellow arrows indicate mitochondria. Scale bar: 1 μm. (D) Quantification of mitochondrial size (n = 65–210 mitochondria) and relative mitochondrial number (n = 4–5 mice) in the GCL of mouse retina and ON. P values by 1-way ANOVA with Bonferroni’s post hoc test. (E) Assessment of mitochondrial function by enzyme histochemical staining for OXPHOS complexes I, II, and IV in the frozen sections of retinas in WT, WT+AAV, ND6, and ND6+AAV mice. Scale bar: 50 μm. (F) ATP levels among retinas of various mice (n = 4 mice) were measured using a luciferin/luciferase assay. (G) Western blot analysis of antioxidant proteins with antibodies of catalase, SOD1, and SOD2, and GAPDH as a loading control. (H) Quantification of catalase, SOD1, and SOD2 in WT, WT+AAV, ND6, and ND6+AAV retinas. Representative of 4 independent experiments. (I) The GSH content and GSH/GSSG ratio measured in various mouse retinas (n = 4 mice). Data in B, D, F, H, and I are shown as mean ± SEM. *P < 0.05; **P < 0.01; ***P < 0.001 by 1-way ANOVA with Bonferroni’s post hoc test.
Mitochondrial dysfunctions increase ROS production and therefore regulate the expression of antioxidant pathways (41, 50, 51). We measured the levels of antioxidant-related proteins, including catalase and superoxide dismutase (SOD1 and SOD2) in mouse retinas. As shown in Figure 6, G and H, the levels of SOD1, SOD2, and catalase in the mutant retinas were 148%, 62%, and 217% of those in WT retinas, respectively. Notably, ND6 treatment restored the levels of these antioxidant proteins in the mutant retinas to levels comparable to those in WT mice. We further examined the ratios of reduced glutathione to oxidized glutathione (GSH/GSSG) as an indicator of oxidative stress in the retina. As shown in Figure 6I, allotopic ND6 expression increased the GSH/GSSG ratio in the mutant retinas to 124% of that in untreated mutants, suggesting that ND6 expression effectively mitigated the overproduction of ROS.
Reduced apoptosis. Our previous study demonstrated that the ND6 mutation impaired cell viability and affected the apoptotic process in cybrids (30, 42). To further investigate the impact of the ND6P25L mutation on apoptosis in vivo, we examined the expression of key genes involved in both intrinsic and extrinsic apoptotic pathways, antiapoptotic regulators, and the execution phase in RNA-seq data (Figure 7, A and B). ND6P25L retinas at 6 months of age exhibited a marked upregulation of executioner caspases (Casp3 and Casp7), intrinsic proapoptotic factors (Bax, Bak1, and Casp9), and a downregulation of the antiapoptotic gene Bcl2, compared with WT retinas. Notably, AAV-mediated ND6 expression restored the expression levels of these genes in ND6P25L mice to levels comparable with those in WT mice. Furthermore, the ratio of Bax to Bcl2, a critical indicator of apoptosis (52), was significantly elevated in the mutant retina and substantially reduced after ND6 treatment, whereas no significant changes were observed in WT retinas following AAV injection (Figure 7C). We further assessed the impact of ND6 overexpression on apoptosis through Western blot analysis. As shown in Figure 7, D and E, 6-month-old ND6P25L retinas displayed significantly increased levels of cytochrome c, BAD, BAX, caspase-3, and caspase-9, along with decreased levels of BCL-2, compared with WT retinas at the same age. Allotopic ND6 expression significantly reduced the levels of cytochrome c, BAD, BAX, and caspase 3, while increasing the levels of BCL-2 in the mutant retina, bringing them to levels comparable to those in WT retinas. We then evaluated the overall apoptosis levels using immunofluorescence analysis of retinal cryosections. As shown in Figure 7F, allotopic ND6 expression resulted in a significant reduction in cleaved caspase-3 levels in the ganglion cell layer and inner nuclear layer of ND6P25L retinas, bringing the levels to those comparable to WT retinas. These data demonstrated that allotopic ND6 expression effectively reduced the overall apoptosis arising from the ND6 mutation.
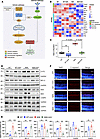 Figure 7
Apoptosis assays. (A) Schematic illustration of intrinsic and extrinsic apoptosis pathways. (B) Heatmap displaying expression of genes involved in apoptosis process by mean-centered log2 TPM in various mice. The specific apoptosis pathways are indicated by different colors. (C) Quantification of the TPM ratio of Bax to Bcl2 in RNA-seq data (n = 3 mice). Boxes indicate the 25th–75th percentiles, center lines indicate medians, and whiskers indicate the minimum and maximum values. Black dots represent individual data points. (D) Western blot analysis of apoptosis-associated proteins. Twenty micrograms of total cellular proteins from various mouse retinas were electrophoresed, electroblotted, and hybridized with CYTC, BAX, BAD, BCL-2, and caspase-3 and -9 antibodies, with GAPDH as a loading control. (E) Quantification of 6 apoptosis-associated proteins. Representative of 4 independent experiments. Data are shown as mean ± SEM. (F) Fluorescence analysis of cleaved caspase-3 protein level in mouse retina at 4 month after injection. Cleaved caspase-3 is shown in red fluorescence, and DAPI-labeled nuclei are shown in blue fluorescence. **P < 0.01; ***P < 0.001 by 1-way ANOVA with Bonferroni’s post hoc test.


