
Research ArticleCell biologyOncology
Open Access |  10.1172/jci.insight.202630
EPHA2 and WNT reciprocally regulate MAPK-dependent gene expression in a pancreatic cancer model
Shawn R. Wadia,1 Changyuan Hu,2,3 Siddhi Patnaik,1 Shreya Sridharan,1 Roger J. Daly,2 David M. Virshup,1,4 and Babita Madan1
1Program in Cancer and Stem Cell Biology, Duke-NUS Medical School, Singapore.
2Cancer Program and Department of Biochemistry and Molecular Biology, Biomedicine Discovery Institute, Monash University, Clayton, Victoria, Australia.
3Wenzhou Medical University-Monash BDI Alliance in Clinical and Experimental Biomedicine, Wenzhou Medical University, Wenzhou, China.
4Department of Pediatrics, Duke University School of Medicine, Durham, North Carolina, USA.
Address correspondence to: Babita Madan, Program in Cancer and Stem Cell Biology, Duke-NUS Medical School, 8 College Road, Singapore 169857. Email: babita.madan@duke-nus.edu.sg. Or to: David M. Virshup, Department of Pediatrics, Duke University School of Medicine, 397 Hanes Building, Durham, North Carolina 27710, USA. Email: david.virshup@duke.edu.
Find articles by
Wadia, S.
in:
PubMed
|
Google Scholar
|

1Program in Cancer and Stem Cell Biology, Duke-NUS Medical School, Singapore.
2Cancer Program and Department of Biochemistry and Molecular Biology, Biomedicine Discovery Institute, Monash University, Clayton, Victoria, Australia.
3Wenzhou Medical University-Monash BDI Alliance in Clinical and Experimental Biomedicine, Wenzhou Medical University, Wenzhou, China.
4Department of Pediatrics, Duke University School of Medicine, Durham, North Carolina, USA.
Address correspondence to: Babita Madan, Program in Cancer and Stem Cell Biology, Duke-NUS Medical School, 8 College Road, Singapore 169857. Email: babita.madan@duke-nus.edu.sg. Or to: David M. Virshup, Department of Pediatrics, Duke University School of Medicine, 397 Hanes Building, Durham, North Carolina 27710, USA. Email: david.virshup@duke.edu.
Find articles by Hu, C. in: PubMed | Google Scholar
1Program in Cancer and Stem Cell Biology, Duke-NUS Medical School, Singapore.
2Cancer Program and Department of Biochemistry and Molecular Biology, Biomedicine Discovery Institute, Monash University, Clayton, Victoria, Australia.
3Wenzhou Medical University-Monash BDI Alliance in Clinical and Experimental Biomedicine, Wenzhou Medical University, Wenzhou, China.
4Department of Pediatrics, Duke University School of Medicine, Durham, North Carolina, USA.
Address correspondence to: Babita Madan, Program in Cancer and Stem Cell Biology, Duke-NUS Medical School, 8 College Road, Singapore 169857. Email: babita.madan@duke-nus.edu.sg. Or to: David M. Virshup, Department of Pediatrics, Duke University School of Medicine, 397 Hanes Building, Durham, North Carolina 27710, USA. Email: david.virshup@duke.edu.
Find articles by Patnaik, S. in: PubMed | Google Scholar
1Program in Cancer and Stem Cell Biology, Duke-NUS Medical School, Singapore.
2Cancer Program and Department of Biochemistry and Molecular Biology, Biomedicine Discovery Institute, Monash University, Clayton, Victoria, Australia.
3Wenzhou Medical University-Monash BDI Alliance in Clinical and Experimental Biomedicine, Wenzhou Medical University, Wenzhou, China.
4Department of Pediatrics, Duke University School of Medicine, Durham, North Carolina, USA.
Address correspondence to: Babita Madan, Program in Cancer and Stem Cell Biology, Duke-NUS Medical School, 8 College Road, Singapore 169857. Email: babita.madan@duke-nus.edu.sg. Or to: David M. Virshup, Department of Pediatrics, Duke University School of Medicine, 397 Hanes Building, Durham, North Carolina 27710, USA. Email: david.virshup@duke.edu.
Find articles by Sridharan, S. in: PubMed | Google Scholar
1Program in Cancer and Stem Cell Biology, Duke-NUS Medical School, Singapore.
2Cancer Program and Department of Biochemistry and Molecular Biology, Biomedicine Discovery Institute, Monash University, Clayton, Victoria, Australia.
3Wenzhou Medical University-Monash BDI Alliance in Clinical and Experimental Biomedicine, Wenzhou Medical University, Wenzhou, China.
4Department of Pediatrics, Duke University School of Medicine, Durham, North Carolina, USA.
Address correspondence to: Babita Madan, Program in Cancer and Stem Cell Biology, Duke-NUS Medical School, 8 College Road, Singapore 169857. Email: babita.madan@duke-nus.edu.sg. Or to: David M. Virshup, Department of Pediatrics, Duke University School of Medicine, 397 Hanes Building, Durham, North Carolina 27710, USA. Email: david.virshup@duke.edu.
Find articles by Daly, R. in: PubMed | Google Scholar
1Program in Cancer and Stem Cell Biology, Duke-NUS Medical School, Singapore.
2Cancer Program and Department of Biochemistry and Molecular Biology, Biomedicine Discovery Institute, Monash University, Clayton, Victoria, Australia.
3Wenzhou Medical University-Monash BDI Alliance in Clinical and Experimental Biomedicine, Wenzhou Medical University, Wenzhou, China.
4Department of Pediatrics, Duke University School of Medicine, Durham, North Carolina, USA.
Address correspondence to: Babita Madan, Program in Cancer and Stem Cell Biology, Duke-NUS Medical School, 8 College Road, Singapore 169857. Email: babita.madan@duke-nus.edu.sg. Or to: David M. Virshup, Department of Pediatrics, Duke University School of Medicine, 397 Hanes Building, Durham, North Carolina 27710, USA. Email: david.virshup@duke.edu.
Find articles by
Virshup, D.
in:
PubMed
|
Google Scholar
|
1Program in Cancer and Stem Cell Biology, Duke-NUS Medical School, Singapore.
2Cancer Program and Department of Biochemistry and Molecular Biology, Biomedicine Discovery Institute, Monash University, Clayton, Victoria, Australia.
3Wenzhou Medical University-Monash BDI Alliance in Clinical and Experimental Biomedicine, Wenzhou Medical University, Wenzhou, China.
4Department of Pediatrics, Duke University School of Medicine, Durham, North Carolina, USA.
Address correspondence to: Babita Madan, Program in Cancer and Stem Cell Biology, Duke-NUS Medical School, 8 College Road, Singapore 169857. Email: babita.madan@duke-nus.edu.sg. Or to: David M. Virshup, Department of Pediatrics, Duke University School of Medicine, 397 Hanes Building, Durham, North Carolina 27710, USA. Email: david.virshup@duke.edu.
Find articles by
Madan, B.
in:
PubMed
|
Google Scholar
|
Published September 8, 2026 - More info
JCI Insight. 2026;11(19):e202630. https://doi.org/10.1172/jci.insight.202630.
© 2026 Wadia et al. This work is licensed under the Creative Commons Attribution 4.0 International License. To view a copy of this license, visit http://creativecommons.org/licenses/by/4.0/.
Received: November 18, 2025; Accepted: August 25, 2026


-
Results
Pharmacological and genetic inhibition of Wnt signaling in vivo triggers ERK phosphorylation and upregulation of MAPK target genes. We have previously shown that inhibition of Wnt signaling using PORCN or tankyrase inhibitors activates the MAPK pathway in Wnt-high, Ras-mutant xenograft tumors (11) (Figure 1A). To determine whether this effect extends beyond pharmacological perturbation, we also examined a genetic model of Wnt pathway suppression in which TCF7L2, the gene encoding the key Wnt effector TCF4, was deleted in HCT116 and HT29 colorectal cancer cells (32). These cells harbor genetic alterations that lead to constitutive activation of both MAPK and Wnt pathways. HCT116 cells harbor KRAS G13D and β-catenin p.Ser45del, whereas HT29 cells carry BRAF V600E and truncating APC mutations (p.Glu853Ter and p.Thr1556Asnfs*3). Tumor xenografts derived from these TCF7L2-KO cells also exhibited elevated ERK phosphorylation (Figure 1B), reinforcing the conclusion that both short-term and long-term Wnt pathway inhibition drives MAPK activation in in vivo models.
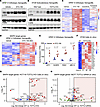 Figure 1
Pharmacological and genetic inhibition of Wnt signaling triggers ERK phosphorylation and upregulation of MAPK target genes. (A) Pharmacological inhibition of Wnt signaling induces ERK phosphorylation in HPAF-II orthotopic xenografts after 4 hours of ETC-159 treatment. Each lane represents tumor lysate from an individual tumor. (B) Genetic inhibition of Wnt signaling via TCF7L2 KO increases ERK phosphorylation in HT29 subcutaneous xenografts (n = 4–6 mice/group). (C) MAPK target set was defined as genes whose induction by ETC-159 was attenuated by 50% or more upon cotreatment with the MEK inhibitor trametinib. RNA-Seq analysis of HPAF-II orthotopic xenografts identified 179 such genes. Heatmap shows their scaled differential expression (z scores). (D and E) Wnt inhibition with ETC-159 upregulates MAPK target gene expression in HPAF-II orthotopic tumors. (D) Heatmap shows z scores for 179 bona fide MAPK targets (n = 6–7 mice/group). (E) Representative MAPK target genes selected from D. Expression shown as mean ± SD; TPM, transcripts per million. Adjusted P values were calculated using the Benjamini-Hochberg method. (F and G) Genetic inhibition of Wnt signaling via TCF7L2 KO increases MAPK target gene expression in HT29 and HCT116 colon cancer cells. (F) Heatmap shows z scores for 35 bona fide MAPK targets in parental HT29 and 3 TCF7L2-KO clones (nos. 57, 83, and 86). (G) Volcano plot shows differential expression of bona fide MAPK targets in TCF7L2-KO versus parental HCT116 cells. *(log2 fold change = 1.32; adjusted P = 1.97 × 10–195). Initial data from Wenzel et al. (32). (H) Knockdown of TCF7L2 upregulates MAPK target genes in MCF7 breast cancer cells. Volcano plot shows differential expression of bona fide MAPK targets in TCF7L2 siRNA–treated versus control siRNA–treated cells. A log2 fold-change threshold of 0.322 (equivalent to 1.25-fold change) was applied. Initial data from Frietze et al. (33).
The transcriptional consequences of this Wnt inhibition–induced ERK activation were further characterized. We curated a set of bona fide MAPK target genes based on their expression profiles in HPAF-II pancreatic xenograft tumors treated with ETC-159 and MEK inhibitor (trametinib) (11). HPAF-II cells have an activating KRAS G12D mutation together with RNF43 inactivating mutations (p.Glu174Ter), leading to simultaneous activation of the MAPK and Wnt pathways. Genes were designated as MAPK targets if their upregulation in response to ETC-159 was more than 50% attenuated by cotreatment with trametinib (Figure 1C), indicating that their induction was ERK dependent. These MAPK target genes, which are robustly upregulated in HPAF-II tumors as early as 56 hours after initiation of Wnt inhibition, remained elevated for up to 7 days in the presence of continued inhibition (Figure 1, D and E, and Supplemental Figure 1; supplemental material available online with this article; https://doi.org/10.1172/jci.insight.202630DS1). Notably, the Wnt inhibition–induced transcriptional activation of MAPK target genes in the pancreatic cancer model was also observed in 2 colorectal cancer models. Reanalysis of published datasets showed that TCF7L2 KO in HT29 and HCT116 colon cancer cells similarly induced many of these MAPK target genes (32) (Figure 1, F and G). Moreover, reanalysis of data from a separate study showed that TCF7L2 knockdown by siRNA in MCF7 breast cancer cells produced a comparable upregulation of MAPK target genes (33) (Figure 1H). Taken together, these findings corroborate and expand upon the finding that inhibition of Wnt/β-catenin signaling by either pharmacological or genetic means leads both to ERK activation and a conserved upregulation of MAPK target genes across multiple tumor models.
Wnt inhibition induces phosphorylation of specific RTKs. Wnt inhibition with PORCN inhibitors in Wnt-high HPAF-II orthotopic xenografts leads to widespread RTK tyrosine phosphorylation, providing a potential link between Wnt inhibition and ERK phosphorylation (Figure 2A) (12). To confirm and extend our previous studies, we probed lysates from vehicle- or ETC-159–treated mice bearing HPAF-II orthotopic tumors and WT or TCF7L2-KO HCT116 tumors using phosphotyrosine-specific antibodies. We observed a robust increase in tyrosine phosphorylation, particularly of proteins in the approximately 140 kDa range in both HPAF-II and HCT116 xenografts (Figure 2, A and B). Further demonstrating that this is a general effect, Wnt-driven MMTV-Wnt1 mammary tumor allografts treated with low doses of C59, a structurally distinct PORCN inhibitor, also showed increased tyrosine phosphorylation (Supplemental Figure 2A).
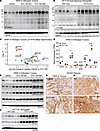 Figure 2
Wnt inhibition induces phosphorylation of specific RTKs including EPHA2, EGFR, and ErbB2. (A) Pharmacological Wnt inhibition increases tyrosine phosphorylation in HPAF-II orthotopic xenografts. Tumor lysates from mice treated with ETC-159 for 8 or 56 hours (n = 4 mice/group) were probed with anti-phosphotyrosine antibody PY1000. (B) Genetic inhibition of Wnt signaling via TCF7L2 KO increases tyrosine phosphorylation in HCT116 subcutaneous xenografts (n = 6 mice/group). (C) Wnt inhibition promotes phosphorylation of specific RTKs, including EPHA2 and EGFR. Volcano plot depicts differential phosphotyrosine enrichment of RTKs in HPAF-II orthotopic xenografts after 56 hours of ETC-159 treatment. Data were obtained by phosphotyrosine IP-MS using PY20 and PY1000 antibodies. (D) RTK expression in HPAF-II orthotopic xenografts. EPHA2 is the most highly expressed EphA receptor in HPAF-II tumors and is modestly upregulated after Wnt inhibition. EPHB6 is kinase dead (n = 4–5 mice/group). EGFR is also highly expressed and modestly induced. Benjamini-Hochberg–adjusted P values are shown (adjusted *P < 0.01 and ****P < 0.0001). (E) ETC-159 treatment induces phosphorylation of EPHA2 at multiple residues in HPAF-II xenografts. Immunoblot shows increased phosphorylation at Y588, Y772, and S897 after 8 or 56 hours of ETC-159 treatment (n = 4 mice/group). (F) Genetic inhibition of Wnt signaling via TCF7L2 KO increases EPHA2 phosphorylation in HCT116 xenografts. Immunoblot shows increased p-EPHA2 (Y588) and total EPHA2 abundance in TCF7L2-KO versus control HCT116 tumors (n = 6 mice/group). (G and H) Wnt inhibition increases cell surface abundance of EPHA2. IHC of EPHA2 in (G) HPAF-II orthotopic xenografts treated with vehicle or ETC-159 (56 hours) and (H) HCT116 parental and TCF7L2-KO xenografts. Scale bars: 100 μm.
To evaluate the relative contributions of specific RTKs to ERK activation and MAPK target gene induction after Wnt inhibition, we performed IP-mass spectrometry (IP-MS) analyses on HPAF-II tumor lysates from vehicle- and ETC-159–treated (8 hours and 56 hours) mice, enriching for tyrosine-phosphorylated peptides using phosphotyrosine-specific antibodies (Supplemental Figure 2B). Peptides were quantified using label-free quantification based on MS1 intensity. A parallel IP-MS analysis was performed on lysates from WT and TCF7L2-KO HCT116 tumors. The HPAF-II IP-MS dataset identified 423 unique tyrosine-phosphorylated proteins, including 35 sites on 14 RTKs in tumors treated for 8 and 56 hours. Among these, EPHA2, EGFR, and ERBB2 showed phosphorylation at multiple sites in response to Wnt inhibition (Supplemental Table 1, Figure 2C, and Supplemental Figure 2C). Independent analysis of the HCT116 dataset revealed similar tyrosine phosphorylation of EPHA2 and ERBB2 (Supplemental Table 2 and Supplemental Figure 2D).
Western blotting was used to validate RTK phosphorylation events identified by IP-MS after Wnt inhibition. Because our anti-phosphotyrosine immunoblots consistently revealed a prominent signal at approximately 140 kDa, we focused on the EPH family of RTKs, several members of which migrate at this molecular weight. Our RNA-Seq analysis indicated that among the EPH receptor family, EPHA2 and EPHB6 were the most highly expressed (Figure 2D), suggesting their potential involvement in this signaling axis (16). Since EPHB6 is kinase deficient (19), we focused on EPHA2. Phosphorylation of EPHA2 Y588, a juxtamembrane residue identified in the IP-MS dataset, was markedly increased as early as 8 hours after the administration of ETC-159 to HPAF-II tumor–bearing mice (Figure 2E). TCF7L2-KO HCT116 tumors showed a similar increase in EPHA2 phosphorylation (Figure 2F). Notably, although total EPHA2 protein abundance showed only a minimal increase after short-term pharmacological Wnt inhibition (Figure 2E), long-term genetic Wnt inhibition via TCF7L2 loss resulted in a pronounced elevation in total EPHA2 abundance (Figure 2F). RNA-Seq of HCT116 cells confirmed that EPHA2 is the most highly expressed EPHA receptor in this model and that EPHA2 transcript levels are upregulated in response to TCF7L2 KO, corroborating the protein-level changes (Figure 2F and Supplemental Figure 2E). A similar induction of EPHA2 transcripts was also observed in TCF7L2-KO HT29 cells (Supplemental Figure 2F).
In the HPAF-II tumors, we examined additional EPHA2 phosphorylation sites as well. Wnt inhibition induced Y772 (activation loop) phosphorylation (34) with as little as 8 hours of treatment (Figure 2E). Interestingly, phosphorylation at the ligand-independent serine residue S897, often linked to protumorigenic signaling and enhanced cell motility, was also increased after ETC-159 treatment, suggesting that both ligand-dependent and ligand-independent EPHA2 pathways are simultaneously activated in response to Wnt inhibition in Wnt-addicted tumors (Figure 2E).
Our prior work indicated that Wnt inhibition drives several RTKs to the plasma membrane of cultured cells. IHC staining confirmed that pharmacological inhibition of Wnt signaling in HPAF-II xenograft tumors similarly drives EPHA2 to the plasma membrane (Figure 2G). Genetic inhibition of Wnt signaling by TCF7L2 KO in HCT116 xenografts also drives EPHA2 to the plasma membrane (Figure 2H). In the appropriate tumor microenvironment, this may facilitate ligand engagement and receptor activation. Taken together, these findings identify EPHA2 as an abundant RTK activated in response to Wnt pathway inhibition.
Loss of EPHA2 leads to nuclear accumulation of activated ERK. There is substantial but conflicting literature on the interaction of EPHA2 and MAPK signaling (22, 24–27). We asked if EPHA2 activation might be responsible for Wnt inhibition–induced ERK phosphorylation in Wnt-addicted tumors. To test this, we knocked out EPHA2 in HPAF-II cells using a 2-guide CRISPR strategy that resulted in the complete deletion of EPHA2’s kinase domain (deletion of exons 10–15) (Supplemental Figure 3A). Two independent EPHA2-KO clones (clones 18 and 21) (Supplemental Figure 3A) were then used to generate orthotopic xenograft tumors (Figure 3, A and D). KO of EPHA2 led to a marked reduction in the intensity of the Wnt-regulated phosphotyrosine band at 140 kDa, consistent with EPHA2 being a major RTK phosphorylated after Wnt inhibition (Figure 3B). The residual signal likely reflects phosphorylation of other EPH family members.
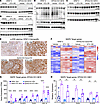 Figure 3
EPHA2 KO induces ERK phosphorylation without concomitant upregulation of MAPK target genes. (A) EPHA2 KO efficacy. Each lane represents an individual parental HPAF-II or EPHA2-KO orthotopic xenograft from mice treated with vehicle or ETC-159 for 8 hours. (n = 3–4 mice/group). (B) Top: EPHA2 KO reduces phosphotyrosine signal at approximately 140 kDa (arrow), consistent with EPHA2 being a major contributor to tyrosine phosphorylation at this molecular weight. ETC-159 does not restore this band in EPHA2-KO tumors (n = 3 mice/group, 8-hour treatment). Bottom: EPHA2 KO markedly increases basal ERK phosphorylation (T202/Y204) with no further enhancement by ETC-159 treatment. (C) EPHA2-KO tumors have elevated p-ERK levels comparable to the ETC-159–treated parental HPAF-II tumors, with no further increase after ETC-159 treatment, indicating that EPHA2 loss alone drives maximal ERK activation at baseline (n = 4–6 mice/group). (D) Increased ERK phosphorylation was confirmed using an independent EPHA2-KO clone 21 (3–4 mice/group). (E) EPHA2 KO induced p-ERK translocation to the nucleus. Representative p-ERK IHC images of tissue sections from parental and EPHA2-KO orthotopic tumors treated with vehicle or ETC-159 for 56 hours. Scale bars: 100 μm. (F) Loss of EPHA2 alone (with concomitant phosphorylation of ERK) does not alter MAPK target gene expression, whereas Wnt inhibition induces these genes in EPHA2-KO xenografts. Heatmap of z scores for 179 bona fide MAPK target genes from Figure 1C (n = 4–5 mice/group; 56 hours of ETC-159 or vehicle treatment). (G) Representative MAPK target genes from F. Benjamini-Hochberg–adjusted P values are shown (adjusted ****P < 0.0001). (H) Lack of MAPK target gene expression induced by EPHA2 KO alone was confirmed in independent clone 21. mRNA abundance determined by RT-qPCR (n = 5 mice/group, 56 hours’ treatment with ETC-159 or vehicle). P values determined by unpaired, 2-tailed Mann-Whitney U test on ΔCq values; **P < 0.01.
We then tested whether EPHA2 KO decreased MAPK activation. Contrary to our expectations, loss of EPHA2 in either clone markedly increased ERK phosphorylation in the orthotopic xenograft tumors (Figure 3, C and D, and Supplemental Figure 3B) to the same level achieved by Wnt inhibition alone. IHC analysis of orthotopic xenograft tissue sections confirmed that EPHA2 KO caused both increased ERK phosphorylation and nuclear accumulation, similar to what was found with ETC-159 treatment (Figure 3E). Notably, EPHA2 KO alone was sufficient to drive substantial nuclear localization of p-ERK, even in the absence of pharmacological Wnt inhibition (Figure 3E).
Unexpected uncoupling of ERK activation and transcriptional response. As shown in Figure 1, the phosphorylation of ERK induced by Wnt inhibition leads to robust upregulation of bona fide MAPK target genes (11) (Figure 1, A and D, and Supplemental Figure 1). We therefore asked if the ERK activation observed in EPHA2-KO tumors resulted in similar transcriptional changes. To this end, we performed RNA-Seq of the EPHA2-WT and -KO tumors. Using cutoffs of 1.5-fold change and adjusted P of 0.05 or less, EPHA2 KO changed the expression of 357 genes, but despite robust nuclear accumulation of p-ERK, these tumors failed to upregulate the panel of previously determined bona fide MAPK target genes (Figure 3, F and G, Supplemental Table 3). Specifically, only 20 of the previously determined 179 MAPK target genes were upregulated by EPHA2 KO. Using an independent MAPK target gene dataset generated from multiple cell lines in vitro (35), we determined only 24 of the EPHA2-regulated genes were MAPK targets. Thus, MAPK activated by EPHA2 loss alone does not recapitulate a robust MAPK transcriptional response. However, Wnt inhibition elicited a strong MAPK transcriptional response in both WT and EPHA2-KO tumors (Figure 3, F and G). Gene set enrichment analysis also showed that although the MAPK target genes were enriched upon Wnt inhibition in parental HPAF-II tumors, no such enrichment was observed in the untreated EPHA2-KO tumors (Supplemental Figure 3C). These findings were corroborated by real-time quantitative PCR (RT-qPCR) analysis of selected MAPK target genes in tumors derived from an independent EPHA2-KO clone (clone 21) that also exhibited elevated ERK phosphorylation (Figure 3, D and H). Taken together, these results indicate that EPHA2 KO–induced p-ERK translocates to the nucleus but does not activate downstream transcription of our predefined gene set.
We previously showed that Wnt inhibition–induced MAPK activation is associated with the upregulation of senescence-associated genes and increased senescence-associated β-gal staining (11). These findings align with prior studies linking unchecked oncogenic MAPK signaling to senescence (29). Since EPHA2-KO tumors display high levels of nuclear p-ERK without concurrent MAPK transcriptional activation, we asked whether they would still exhibit a senescence-associated transcriptional profile. To address this question, we assessed the expression of 79 senescence-associated genes from the SenMayo gene set using RNA-Seq data from WT and EPHA2-KO tumors treated with or without ETC-159 (36). As expected, Wnt inhibition induced robust upregulation of a subset of senescence-associated genes in WT xenografts. Importantly, despite elevated ERK phosphorylation, the expression profile of EPHA2-KO tumors closely resembled that of vehicle-treated WT tumors and showed no upregulation or enrichment of ETC-159–responsive senescence genes (Figure 4, A and B, and Supplemental Figure 4A). However, Wnt inhibition triggered comparable changes in senescence gene expression in both WT and KO tumors, confirming that EPHA2-KO tumors retain transcriptional responsiveness to attenuated Wnt signaling (Figure 4, A and B). Consistent with these findings, baseline levels of senescence-associated β-gal staining were similar between EPHA2-KO and WT tumors, despite high levels of p-ERK in the EPHA2-KO tumors (Figure 4C). PORCN inhibition robustly increased senescence-associated β-gal staining in both groups, demonstrating that EPHA2-KO tumors remain fully competent to undergo senescence upon Wnt withdrawal.
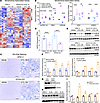 Figure 4
EPHA2 KO–induced ERK phosphorylation does not elicit senescence, and GATA3 is a candidate Wnt-regulated MAPK transcriptional repressor. (A) Heatmap of scaled differential gene expression values (z scores) for 79 senescence-associated genes (SenMayo gene set) (36) in response to Wnt inhibition with or without EPHA2 KO, n = 4–5 mice/group; treated with 37.5 mg/kg bid ETC-159 or vehicle for 56 hours. Loss of EPHA2 alone does not significantly alter the expression of senescence-associated genes despite MAPK activation. (B) Expression of representative senescence-associated genes selected from A. Despite activation of ERK, EPHA2 KO alone does not induce these targets. Data represent mean ± SD; TPM, transcripts per million (n = 4–5 mice/group). Benjamini-Hochberg–adjusted P values are shown (adjusted **P < 0.01 and ****P < 0.0001). (C) Despite activation of ERK, loss of EPHA2 does not induce senescence in orthotopic xenografts. OCT tumor sections were stained for senescence-associated β-gal activity. Representative images are shown. Scale bars: 100 μm. (D) Wnt inhibition (56 hours) decreases GATA3 gene expression in both parental and EPHA2-KO tumors. Benjamini-Hochberg–adjusted P values are shown (adjusted ****P < 0.0001). (E) Wnt inhibition (56 hours) decreases GATA3 protein abundance in both parental and EPHA2-KO tumors (2 independent EPHA2-KO clones). (F) In vitro knockdown of GATA3 derepresses a subset of MAPK target genes in EPHA2-KO cells, as assessed by RT-qPCR 48 hours after knockdown. (G) Western blot shows reduced GATA3 protein abundance in GATA3 siRNA–treated cells. (H) Western blot shows reduced GATA3 protein abundance in GATA3 partial KO clone 15. (I) Moderate increase in expression of select MAPK target genes in GATA3 partial KO clone 15 compared to parental HPAF-II cells cultured in vitro.
Thus, robust phosphorylation of ERK activation sites after EPHA2 KO induced neither MAPK target genes (Figure 3, F–H) nor the senescence-associated genes upregulated by Wnt inhibition (Figure 4, A and B, and Supplemental Figure 4A). However, the EPHA2-KO tumors remained responsive to Wnt inhibition, indicating that additional Wnt-dependent mechanisms gate the transcriptional output of nuclear p-ERK in this context.
Wnt-regulated transcriptional repressors may constrain MAPK target gene expression. The discrepancy in transcriptional responses between EPHA2 KO–induced and ETC-159–induced p-ERK led us to hypothesize the existence of a Wnt-regulated transcriptional repressor that may restrict MAPK target gene activation even if upstream RTKs are active. This is consistent with our previous model that Wnt signaling dampens ERK-regulated transcription (11). To identify candidate repressors, we looked for transcription factors that are repressed by Wnt inhibition but not by EPHA2 KO and are predicted to bind to the promoters of our 179 bona fide MAPK target genes as determined using ChIP-X Enrichment Analysis 3 (ChEA3).
Among the top candidates was GATA3, a zinc-finger transcription factor transcriptionally and posttranscriptionally regulated by the Wnt pathway (33, 37) (Figure 4, D and E). Western blot analysis confirmed a marked reduction in GATA3 protein levels after Wnt inhibition in both HPAF-II WT and EPHA2-KO tumors (Figure 4E). To assess whether GATA3 functionally represses MAPK target genes, we knocked down GATA3 in EPHA2-KO cells. GATA3 knockdown modestly increased the expression of selected MAPK targets, WNT7A, DUSP5, EPHA4, and CST1 (Figure 4, F and G). Similarly, in the GATA3 partial KO cells that we were able to obtain, we observed a moderate increase in selected MAPK target genes (Figure 4, H and I). This modest effect in vitro is likely due to low basal ERK activity in HPAF-II cells in vitro, particularly in the absence of extracellular EGFR and Eph-family ligands that are more abundant in vivo. Although preliminary, these findings support a model in which GATA3 and related transcriptional repressors limit MAPK target gene expression in the Wnt-high condition, with their downregulation upon Wnt inhibition facilitating a transcriptional response to ERK activation.
EPHA2 KO activates EGFR to drive ERK phosphorylation. Our xenograft studies utilizing 2 independent EPHA2-KO clones confirmed that loss of EPHA2 robustly activates ERK phosphorylation in Wnt-addicted pancreatic cancers (Figure 3). To understand how EPHA2 loss triggered ERK phosphorylation, we performed IP-MS on parental and EPHA2-KO xenograft tumors with or without PORCN inhibition. This analysis revealed that KO of EPHA2 resulted in increased phosphorylation of EGFR at multiple tyrosine residues including Y1138, Y1172, and Y1197, several-fold higher than induced by Wnt inhibition alone (Figure 5, A and B, and Supplemental Figure 5A). This more robust activation of EGFR also correlated with increased phosphorylation of downstream Src-family kinases (Supplemental Figure 5B). Notably, the same EGFR sites were identified in our prior IP-MS analysis as being phosphorylated in response to Wnt inhibition in parental HPAF-II tumors (Figure 2C). Wnt inhibition in the EPHA2-KO tumors did not increase EGFR phosphorylation further (Figure 5B). These findings indicate that EPHA2 normally suppresses EGFR activation in tumors, consistent with previous reports showing repressive interaction between EPHA2 and components of the EGFR/MAPK pathway (25, 26).
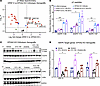 Figure 5
EGFR activation in response to EPHA2 KO drives ERK phosphorylation and contributes to MAPK target gene expression after Wnt inhibition. (A) EPHA2 loss leads to phosphorylation of EGFR at specific tyrosine residues. Volcano plot representing RTKs phosphorylated in response to EPHA2 KO in HPAF-II orthotopic tumors. Phosphoproteomic data obtained as described in Methods. (B) EPHA2 KO is a more potent inducer of EGFR phosphorylation than Wnt inhibition. Specific phosphorylation sites are indicated. Only experimentally obtained datapoints are shown; imputed values were excluded. n = 3–5 mice/group. Differential analysis was performed using the R package limma with Benjamini-Hochberg adjustment for multiple testing (adjusted *P < 0.05, **P < 0.01, ***P < 0.001). (C) EPHA2 KO–induced phosphorylation of EGFR (top) and ERK (bottom) is largely abrogated by treatment with erlotinib (100 mg/kg), an EGFR inhibitor. Mice with orthotopic xenografts received a single dose of the indicated drugs including ETC-159 (75 mg/kg), and tumors were harvested 8 hours later. (D) MAPK target genes induced by Wnt inhibition in EPHA2-KO tumors are sensitive to cotreatment with erlotinib. Expression of selected MAPK target genes was assessed by RT-qPCR in samples from C. Data were analyzed using unpaired, 2-tailed Mann-Whitney U test on ΔCq values, *P < 0.05. Relative normalized expression is shown.
Given that EPHA2 KO activated both EGFR and Src-family kinases, we next asked whether the increased EGFR activity was the primary driver of activated ERK in the EPHA2-KO tumors. To test this, mice bearing EPHA2-KO tumors were treated with the EGFR inhibitor erlotinib, either alone or in combination with ETC-159. As expected, erlotinib treatment led to a marked reduction in EGFR phosphorylation at Y1068, a well-characterized activating residue (Figure 5C). Strikingly, ERK phosphorylation was also markedly reduced in EPHA2-KO tumors after erlotinib treatment, and concurrent Wnt inhibition did not restore ERK phosphorylation (Figure 5C). These findings indicate that the ERK activation observed in response to EPHA2 loss is largely driven by activated EGFR. In the EPHA2-KO tumors, erlotinib also decreased both basal and ETC-159–activated expression of a subset of MAPK target genes, consistent with inhibition of both EGFR and its downstream signaling kinases (Figure 5D).
Residual ERK phosphorylation was observed in tumors cotreated with ETC-159 and erlotinib (Figure 5C), which may be the consequence of several factors, including the presence of mutant RAS and membrane recycling of additional RTKs such as ERBB2, which was also detected in our IP-MS analysis (Figure 5A).
Wnt inhibition works in large part via EGFR to activate ERK and MAPK target gene expression. Our initial hypothesis was that Wnt inhibition turned on EPHA2 kinase activity, which in turn was responsible for increased ERK phosphorylation. However, EPHA2 KO experiments disproved this, as loss of EPHA2 alone led to a robust and sustained increase in ERK phosphorylation, even in the absence of Wnt inhibition (Figure 3). This suggests that EPHA2 may function as a negative regulator of MAPK signaling, consistent with prior findings in breast and lung cancer models (25, 26). Given these results, we revisited the question of which RTK mediates the ERK activation in response to Wnt inhibition.
Our previous work demonstrated that Wnt inhibition increases EGFR surface abundance and phosphorylation in HPAF-II tumors (12), supporting a model in which EGFR is activated downstream of Wnt suppression. Our current IP-MS data revealed phosphorylation at multiple EGFR tyrosine residues (Y1138, Y1172, Y1197) after either Wnt inhibition or EPHA2 loss (Figure 2C and Figure 5, A and B), indicating that EGFR may serve as a common upstream regulator of ERK activation in both EPHA2 KO and Wnt inhibition conditions.
To functionally assess EGFR’s role in Wnt-regulated MAPK activation, we treated orthotopic xenografts with vehicle, ETC-159, erlotinib, or the combination of ETC-159 and erlotinib. As expected, erlotinib treatment prevented EGFR phosphorylation (Figure 6A). The ERK activation caused by Wnt inhibition was partially attenuated by erlotinib cotreatment (Figure 6A). At the transcriptional level, the MAPK target genes induced by Wnt inhibition (e.g., ARL14, WNT7A) were also reduced by erlotinib (Figure 6, B and C). These findings indicate that EGFR contributes substantially, but not exclusively, to ERK activation and MAPK gene induction after Wnt inhibition in HPAF-II xenografts.
 Figure 6
Wnt inhibition–mediated EGFR activation is partially responsible for ERK phosphorylation and MAPK target gene expression. (A) EGFR phosphorylation induced by Wnt inhibition is abrogated by erlotinib. Mice bearing HPAF-II orthotopic xenografts were treated with a single dose of ETC-159 (75 mg/kg) and/or erlotinib (100 mg/kg), and tumors were harvested 8 hours later. n = 3–4 mice/group. In the same samples, Wnt inhibition–induced ERK activation is also reduced by erlotinib. (B and C) Erlotinib treatment blunted the upregulation of MAPK target genes induced by ETC-159. (B) A single dose of 75 mg/kg 8 hours prior to harvest or (C) 37.5 mg/kg twice daily for 56 hours prior to harvest. Relative mRNA abundance of MAPK target genes was determined by RT-qPCR. n = 2–5 mice/group. Data were analyzed using unpaired, 2-tailed Mann-Whitney U test on ΔCq values, *P < 0.05. Relative normalized expression is shown. (D) ETC-159 and erlotinib in combination inhibit the growth of HPAF-II subcutaneous xenografts. Erlotinib alone (50 mg/kg/day) does not significantly inhibit tumor growth, while low-dose ETC-159 (10 mg/kg once daily) slows tumor progression. Combining ETC-159 with erlotinib markedly reduced tumor growth. n = 6–10 tumors/group. Tumor volumes on day 15 were analyzed by unpaired, 2-tailed Mann-Whitney U tests, **P < 0.01, ***P < 0.001. Data are presented as mean ± SD.
Consistent with a broader RTK response after Wnt inhibition, phosphotyrosine profiling also confirmed phosphorylation of ERBB2 at Y1248 after ETC-159 treatment (Figure 2C). Although we have not directly tested the functional role of ERBB2 in this setting, these observations support the model that Wnt inhibition allows a number of RTKs including EGFR, ERBB2, and EPHA2 to recycle to the plasma membrane, where a subset then further activate MAPK signaling even in the setting of mutant RAS.
Wnt inhibition partially restores sensitivity to erlotinib. HPAF-II tumors are driven by a combination of Wnt and KRAS(G12D) pathway activation. Consequently, treatment of HPAF-II xenograft–bearing mice with the EGFR inhibitor erlotinib (upstream of RAS) alone did not decrease tumor growth (Figure 6D) but, as previously reported, a low dose of ETC-159 modestly suppressed tumor growth (9). Notably, in the presence of low-dose ETC-159, erlotinib treatment resulted in a significant growth inhibition at 15 days of treatment (Figure 6D). This suggests that the activation of EGFR by Wnt inhibition promotes network rewiring and hence sensitivity to erlotinib (38). Attenuation of EGFR/RAS/MAPK signaling may also be more effective when layered onto a transcriptional landscape already downregulated by Wnt inhibition, which inhibits expression of genes involved in cell cycle control, DNA repair, and ribosome biogenesis (10, 16). Because Wnt inhibition activates more RTKs than EGFR alone, future studies can address whether additional RTK inhibitors may give more robust effects.
Knocking out EPHA2 mildly accelerates tumor growth while enhancing sensitivity to both Wnt inhibition and erlotinib. Given the unexpected absence of MAPK target gene induction despite robust nuclear p-ERK accumulation in EPHA2-KO tumors (Figure 3), we investigated whether this decoupling of ERK phosphorylation from transcriptional output had additional functional consequences in vivo. Tumor growth analysis revealed that EPHA2-KO tumors grew marginally faster than the WT tumors, perhaps by increased activation of both EGFR and additional kinases downstream of EGFR (Figure 7, A and B, and Supplemental Figure 5B). However, the growth of the EPHA2-KO tumors remained sensitive to Wnt pathway inhibition (30 mg/kg ETC-159) (Figure 7, A and B). Ki-67 and H&E staining confirmed that EPHA2-KO tumors were morphologically similar to the parental HPAF-II tumors and were highly proliferative (Figure 7C and Supplemental Figure 6A). Treatment with ETC-159 markedly reduced the number of Ki-67–positive cells, mirroring results observed in the parental HPAF-II tumors and underscoring the fact that EPHA2 loss does not impair responsiveness to Wnt inhibition.
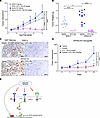 Figure 7
EPHA2 KO increases sensitivity to Wnt and EGFR inhibition. (A and B) KO of EPHA2 potentiates the growth of HPAF-II subcutaneous xenografts (P < 0.05 at postinjection day 30). EPHA2-KO xenografts are significantly larger than their WT counterparts. EPHA2-KO tumors retain their sensitivity to Wnt inhibition. n = 8–12 subcutaneous tumors/group, treated with ETC-159 30 mg/kg/d or vehicle for 20 days. Tumor volumes on day 30 and tumor weights were analyzed by unpaired 2-tailed Mann-Whitney U test, ****P < 0.0001. Data are presented as mean ± SD. (C) Parental and EPHA2-KO HPAF-II xenografts have comparable numbers of Ki67-positive proliferating cells. EPHA2-KO xenografts have reduced proliferation in response to Wnt inhibition, similar to the effect of Wnt inhibition on control xenografts. Scale bars: 200 μm. (D) EPHA2 KO increases tumor sensitivity to both low-dose ETC-159 (10 mg/kg) and erlotinib (50 mg/kg) treatment. n = 6–10 subcutaneous tumors/group. Tumor volumes at day 15 were analyzed by unpaired 2-tailed Mann-Whitney U test, *P < 0.05, **P < 0.01, ****P < 0.0001. Data are presented as mean ± SD. (E) Model: Active Wnt signaling slows receptor recycling, thereby preventing the activation of RTKs such as EPHA2 and EGFR. It also stabilizes a repressive transcription factor (e.g., GATA3). When Wnt signaling is inhibited (e.g., via ETC-159 or TCF7L2 KO), EGFR becomes activated, ERK is phosphorylated, and concurrently the repressive factor(s) is deactivated, turning on MAPK target gene expression. However, when EPHA2 alone is blocked, EGFR and ERK are still phosphorylated but the Wnt-regulated repressor remains active, preventing activation of MAPK target genes.
We next examined the importance of the EPHA2/EGFR axis in regulating tumor growth. The EPHA2-KO tumors with activated EGFR became sensitive to EGFR inhibition with erlotinib (Figure 7D), again, likely due to activation of other kinases downstream of EGFR (Supplemental Figure 5B). What was especially striking was that the EPHA2-KO tumors now became much more sensitive to low-dose Wnt inhibition (10 mg/kg ETC-159) (Figure 7D compared with Figure 7A). This is consistent with the model that robust activation of MAPK signaling leads to differentiation and senescence, although other models are possible. Further study is needed to define this more precisely. Collectively, our results indicate that loss of EPHA2 and inhibition of Wnt signaling enhance the reliance of KRAS mutant Wnt-driven pancreatic cancers on EGFR signaling (Figure 7D). Additionally, the increased sensitivity of EPHA2-deficient tumors to both Wnt and EGFR inhibition suggests that EPHA2 loss may enhance RTK/MAPK and Wnt pathway dependencies due to signaling rewiring.


