Go to The Journal of Clinical Investigation
  • About
  • Editors
  • Consulting Editors
  • For authors
  • Journal stats
  • Publication ethics
  • Publication alerts by email
  • Transfers
  • Advertising
  • Job board
  • Contact
  • Physician-Scientist Development
  • Current issue
  • Past issues
  • By specialty
    • COVID-19
    • Cardiology
    • Immunology
    • Metabolism
    • Nephrology
    • Oncology
    • Pulmonology
    • All ...
  • Videos
  • Collections
    • In-Press Preview
    • Resource and Technical Advances
    • Clinical Research and Public Health
    • Research Letters
    • Editorials
    • Perspectives
    • Physician-Scientist Development
    • Reviews
    • Top read articles

  • Current issue
  • Past issues
  • Specialties
  • In-Press Preview
  • Resource and Technical Advances
  • Clinical Research and Public Health
  • Research Letters
  • Editorials
  • Perspectives
  • Physician-Scientist Development
  • Reviews
  • Top read articles
  • About
  • Editors
  • Consulting Editors
  • For authors
  • Journal stats
  • Publication ethics
  • Publication alerts by email
  • Transfers
  • Advertising
  • Job board
  • Contact
Top
  • View PDF
  • Download citation information
  • Send a comment
  • Terms of use
  • Standard abbreviations
  • Need help? Email the journal
  • Top
  • Abstract
  • Introduction
  • Results
  • Discussion
  • Methods
  • Author contributions
  • Conflict of interest
  • Funding support
  • Supplemental material
  • Acknowledgments
  • Footnotes
  • References
  • Version history
  • Article usage
  • Citations to this article
Advertisement

Research ArticleClinical ResearchGeneticsOncology Open Access | 10.1172/jci.insight.201996

Human Y chromosome pan-organ mapping reveals progressive mosaic loss from normal to cancer

Arkadiusz Gertych,1,2 Huihui Ye,2 Xingyu Chen,3,4 Eric Vail,2 V. Krishnan Ramanujan,2 Lauren Brady,5 Lawrence D. True,6 Peter S. Nelson,5,6 Peter R. Carroll,7 and Dan Theodorescu2,3,8

1Department of Surgery,

2Department of Pathology and Laboratory Medicine,

3Department of Urology, and

4Department of Biomedical Sciences, Cedars-Sinai Medical Center, Los Angeles, California, USA.

5Fred Hutchinson Cancer Center, Seattle, Washington, USA.

6Department of Laboratory Medicine and Pathology, University of Washington, Seattle, Washington, USA.

7Department of Urology, UCSF, San Francisco, California, USA.

8University of Arizona Comprehensive Cancer Center, Tucson, Arizona, USA.

Address correspondence to: Dan Theodorescu, University of Arizona Comprehensive Cancer Center, University of Arizona, 1515 North Campbell Ave., Tucson, Arizona, 85724, USA. Phone: 520.694.2873; Email: theodorescu@arizona.edu.

Authorship note: AG and HY contributed equally to this work.

Find articles by Gertych, A. in: PubMed | Google Scholar

1Department of Surgery,

2Department of Pathology and Laboratory Medicine,

3Department of Urology, and

4Department of Biomedical Sciences, Cedars-Sinai Medical Center, Los Angeles, California, USA.

5Fred Hutchinson Cancer Center, Seattle, Washington, USA.

6Department of Laboratory Medicine and Pathology, University of Washington, Seattle, Washington, USA.

7Department of Urology, UCSF, San Francisco, California, USA.

8University of Arizona Comprehensive Cancer Center, Tucson, Arizona, USA.

Address correspondence to: Dan Theodorescu, University of Arizona Comprehensive Cancer Center, University of Arizona, 1515 North Campbell Ave., Tucson, Arizona, 85724, USA. Phone: 520.694.2873; Email: theodorescu@arizona.edu.

Authorship note: AG and HY contributed equally to this work.

Find articles by Ye, H. in: PubMed | Google Scholar

1Department of Surgery,

2Department of Pathology and Laboratory Medicine,

3Department of Urology, and

4Department of Biomedical Sciences, Cedars-Sinai Medical Center, Los Angeles, California, USA.

5Fred Hutchinson Cancer Center, Seattle, Washington, USA.

6Department of Laboratory Medicine and Pathology, University of Washington, Seattle, Washington, USA.

7Department of Urology, UCSF, San Francisco, California, USA.

8University of Arizona Comprehensive Cancer Center, Tucson, Arizona, USA.

Address correspondence to: Dan Theodorescu, University of Arizona Comprehensive Cancer Center, University of Arizona, 1515 North Campbell Ave., Tucson, Arizona, 85724, USA. Phone: 520.694.2873; Email: theodorescu@arizona.edu.

Authorship note: AG and HY contributed equally to this work.

Find articles by Chen, X. in: PubMed | Google Scholar

1Department of Surgery,

2Department of Pathology and Laboratory Medicine,

3Department of Urology, and

4Department of Biomedical Sciences, Cedars-Sinai Medical Center, Los Angeles, California, USA.

5Fred Hutchinson Cancer Center, Seattle, Washington, USA.

6Department of Laboratory Medicine and Pathology, University of Washington, Seattle, Washington, USA.

7Department of Urology, UCSF, San Francisco, California, USA.

8University of Arizona Comprehensive Cancer Center, Tucson, Arizona, USA.

Address correspondence to: Dan Theodorescu, University of Arizona Comprehensive Cancer Center, University of Arizona, 1515 North Campbell Ave., Tucson, Arizona, 85724, USA. Phone: 520.694.2873; Email: theodorescu@arizona.edu.

Authorship note: AG and HY contributed equally to this work.

Find articles by Vail, E. in: PubMed | Google Scholar

1Department of Surgery,

2Department of Pathology and Laboratory Medicine,

3Department of Urology, and

4Department of Biomedical Sciences, Cedars-Sinai Medical Center, Los Angeles, California, USA.

5Fred Hutchinson Cancer Center, Seattle, Washington, USA.

6Department of Laboratory Medicine and Pathology, University of Washington, Seattle, Washington, USA.

7Department of Urology, UCSF, San Francisco, California, USA.

8University of Arizona Comprehensive Cancer Center, Tucson, Arizona, USA.

Address correspondence to: Dan Theodorescu, University of Arizona Comprehensive Cancer Center, University of Arizona, 1515 North Campbell Ave., Tucson, Arizona, 85724, USA. Phone: 520.694.2873; Email: theodorescu@arizona.edu.

Authorship note: AG and HY contributed equally to this work.

Find articles by Ramanujan, V. in: PubMed | Google Scholar

1Department of Surgery,

2Department of Pathology and Laboratory Medicine,

3Department of Urology, and

4Department of Biomedical Sciences, Cedars-Sinai Medical Center, Los Angeles, California, USA.

5Fred Hutchinson Cancer Center, Seattle, Washington, USA.

6Department of Laboratory Medicine and Pathology, University of Washington, Seattle, Washington, USA.

7Department of Urology, UCSF, San Francisco, California, USA.

8University of Arizona Comprehensive Cancer Center, Tucson, Arizona, USA.

Address correspondence to: Dan Theodorescu, University of Arizona Comprehensive Cancer Center, University of Arizona, 1515 North Campbell Ave., Tucson, Arizona, 85724, USA. Phone: 520.694.2873; Email: theodorescu@arizona.edu.

Authorship note: AG and HY contributed equally to this work.

Find articles by Brady, L. in: PubMed | Google Scholar |

1Department of Surgery,

2Department of Pathology and Laboratory Medicine,

3Department of Urology, and

4Department of Biomedical Sciences, Cedars-Sinai Medical Center, Los Angeles, California, USA.

5Fred Hutchinson Cancer Center, Seattle, Washington, USA.

6Department of Laboratory Medicine and Pathology, University of Washington, Seattle, Washington, USA.

7Department of Urology, UCSF, San Francisco, California, USA.

8University of Arizona Comprehensive Cancer Center, Tucson, Arizona, USA.

Address correspondence to: Dan Theodorescu, University of Arizona Comprehensive Cancer Center, University of Arizona, 1515 North Campbell Ave., Tucson, Arizona, 85724, USA. Phone: 520.694.2873; Email: theodorescu@arizona.edu.

Authorship note: AG and HY contributed equally to this work.

Find articles by True, L. in: PubMed | Google Scholar |

1Department of Surgery,

2Department of Pathology and Laboratory Medicine,

3Department of Urology, and

4Department of Biomedical Sciences, Cedars-Sinai Medical Center, Los Angeles, California, USA.

5Fred Hutchinson Cancer Center, Seattle, Washington, USA.

6Department of Laboratory Medicine and Pathology, University of Washington, Seattle, Washington, USA.

7Department of Urology, UCSF, San Francisco, California, USA.

8University of Arizona Comprehensive Cancer Center, Tucson, Arizona, USA.

Address correspondence to: Dan Theodorescu, University of Arizona Comprehensive Cancer Center, University of Arizona, 1515 North Campbell Ave., Tucson, Arizona, 85724, USA. Phone: 520.694.2873; Email: theodorescu@arizona.edu.

Authorship note: AG and HY contributed equally to this work.

Find articles by Nelson, P. in: PubMed | Google Scholar

1Department of Surgery,

2Department of Pathology and Laboratory Medicine,

3Department of Urology, and

4Department of Biomedical Sciences, Cedars-Sinai Medical Center, Los Angeles, California, USA.

5Fred Hutchinson Cancer Center, Seattle, Washington, USA.

6Department of Laboratory Medicine and Pathology, University of Washington, Seattle, Washington, USA.

7Department of Urology, UCSF, San Francisco, California, USA.

8University of Arizona Comprehensive Cancer Center, Tucson, Arizona, USA.

Address correspondence to: Dan Theodorescu, University of Arizona Comprehensive Cancer Center, University of Arizona, 1515 North Campbell Ave., Tucson, Arizona, 85724, USA. Phone: 520.694.2873; Email: theodorescu@arizona.edu.

Authorship note: AG and HY contributed equally to this work.

Find articles by Carroll, P. in: PubMed | Google Scholar

1Department of Surgery,

2Department of Pathology and Laboratory Medicine,

3Department of Urology, and

4Department of Biomedical Sciences, Cedars-Sinai Medical Center, Los Angeles, California, USA.

5Fred Hutchinson Cancer Center, Seattle, Washington, USA.

6Department of Laboratory Medicine and Pathology, University of Washington, Seattle, Washington, USA.

7Department of Urology, UCSF, San Francisco, California, USA.

8University of Arizona Comprehensive Cancer Center, Tucson, Arizona, USA.

Address correspondence to: Dan Theodorescu, University of Arizona Comprehensive Cancer Center, University of Arizona, 1515 North Campbell Ave., Tucson, Arizona, 85724, USA. Phone: 520.694.2873; Email: theodorescu@arizona.edu.

Authorship note: AG and HY contributed equally to this work.

Find articles by Theodorescu, D. in: PubMed | Google Scholar |

Authorship note: AG and HY contributed equally to this work.

Published September 8, 2026 - More info

Published in Volume 11, Issue 17 on September 8, 2026
JCI Insight. 2026;11(17):e201996. https://doi.org/10.1172/jci.insight.201996.
© 2026 Gertych et al. This work is licensed under the Creative Commons Attribution 4.0 International License. To view a copy of this license, visit http://creativecommons.org/licenses/by/4.0/.
Published September 8, 2026 - Version history
Received: November 5, 2025; Accepted: July 14, 2026
View PDF
Abstract

BACKGROUND. Loss of the Y chromosome (LOY) is a frequent event in male tumors and has been linked to cancer progression. However, the degree of mosaic LOY (mLOY) within normal tissues from men with or without cancer remains uncharacterized.

METHODS. Here we used a FISH-based assay targeting X- and Y-chromosome centromeres to perform a pan-organ analysis of mLOY in 1,000 male tissue samples from 405 individuals representing 11 organs. Automated image processing generated a quantitative FISH-based mLOY score (YchrFISH) that we validated against a transcriptomic surrogate of Y-chromosome dosage from RNA-seq data.

RESULTS. mLOY burden varied by tumor type, with highest degree in colorectal carcinoma. Across tissue groups, YchrFISH scores declined progressively from normal tissues of cancer-free men to histologically normal tissues adjacent to cancer and carcinoma (P < 0.0001). Paired analyses confirmed consistently greater mLOY in malignant compared with tumor-adjacent histologically normal tissue in different organs. Spatially resolved RNA-seq maps of bladders removed for cancer demonstrated a transcriptional gradient of Y-chromosome loss from normal urothelium through intraepithelial neoplasia to invasive carcinoma.

CONCLUSION. mLOY gradients exist across histologically normal and malignant tissues, consistent with the concept of field cancerization. Our findings support epithelial mLOY as a biomarker of early malignant transformation and, to our knowledge, a previously unrecognized hallmark of male oncogenesis.

FUNDING. NIH grants R35CA294022, P01CA163227, and P50CA97186 (the Pacific Northwest Prostate Cancer SPORE) and the Institute for Prostate Cancer Research.

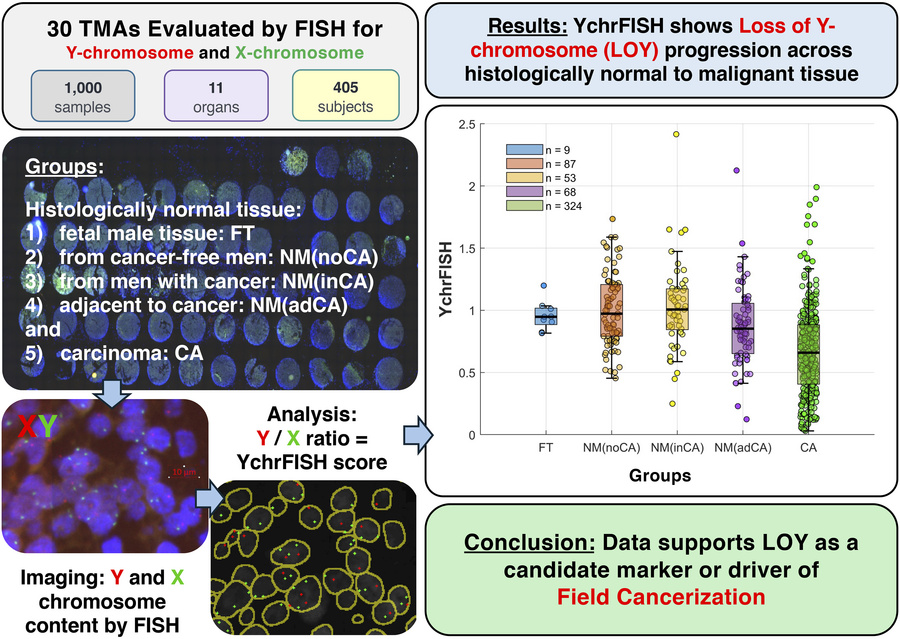
Graphical Abstract
graphical abstract
Introduction

Loss of the Y chromosome (LOY) in a certain proportion of peripheral blood mononuclear cells (PBMCs) (1), termed mosaic LOY (mLOY) (2), is the most common genomic alteration in aging males and is linked to increased incidence and mortality in several cancer types, including lung, prostate, colon, and bladder (3–7). mLOY has also been observed in cancer cells and its degree varies in different tumor types, with the highest seen in papillary renal cell carcinoma (80%) and esophageal cancer (57%) and the lowest (<2%) seen in pheochromocytoma, paraganglioma, and thymoma (8, 9). While mLOY was extensively studied in blood cells and tumor tissue in pan-cancer genomic analyses, the degree of mLOY in normal tissue and premalignant lesions has not been systematically studied across different types of tissue.

Several studies have been performed to evaluate the degree of mLOY in benign tissues in various organs. A study of 277 samples of histologically normal urothelium and 145 bladder urothelial carcinoma showed that mLOY identified using single-nucleotide polymorphism microarray is found in 18% of normal urothelium and 29% of tumors (10). mLOY was also observed using fluorescence in situ hybridization (FISH) in benign hyperplastic prostatic epithelium in 8 out of 17 samples of prostate cancer exhibiting mLOY in the malignant epithelium of the same patient (11). A study using FISH detected concordant mLOY in ductal carcinoma in situ (CIS) adjacent to invasive breast cancer in 17 out of 22 male patients (12). However, little is known about the degree of mLOY in normal tissues from patients without a cancer history and normal tissue uninvolved with cancer, from cancer patients. Here we test the hypothesis that mLOY is an early event in cancer development, detectable across multiple organs in histologically normal tissues of cancer patients. We do this through an analysis of mLOY across 1,000 samples of normal tissues from men with or without cancer and malignant epithelium of different tissue types.

Results

Construction of a multiorgan tissue microarray repository. We assembled a cohort of 2,917 formalin-fixed, paraffin-embedded (FFPE) tissue cores from males spanning fetal development to late adulthood (age range: 0.4–101 years). These cores were drawn from 7 institutional and commercial sources and categorized into 5 groups: fetal tissue (gestational age range: 0.4–0.5 years) (FT), histologically normal tissue from cancer-free men [NM(noCA)], histologically normal tissue from men with cancer in another tissue [NM(inCA)], histologically normal epithelium immediately adjacent to cancer [NM(adCA)], and carcinoma (CA) itself. The slide-level breakdown is the following: Cedars-Sinai autopsy multiorgan (CSMC-A, 4 slides; 645 cores), commercial multiorgan (COM-M, 6 slides; 431 cores), commercial fetal multiorgan (COM-FT, 1 slide; 57 cores), University of Virginia multiorgan (UVA, 2 slides; 284 cores), University of California San Francisco prostate (UCSF, 6 slides; 613 cores), Cooperative Human Tissue Network prostate/colon (CHTN, 2 slides; 220 cores), and Cedars-Sinai Medical Center bladder (CSMC-B, 9 slides; 667 cores). The samples covered 11 major organs, including bladder, prostate, kidney, liver, pancreas, stomach, colon, rectum, lung, esophagus, and head-and-neck regions from 405 individuals (Table 1).

Table 1

Summary of TMA slides

Validation of the mLOY assay. The AneuVysion Multicolor DNA Probe Kit, a dual-color FISH assay targeting the centromeres of the X and Y chromosomes (13, 14), was used to detect X and Y chromosomes on tissue microarray (TMA) sections. Stringent image quality control based on contrast-to-noise ratio (CNR) metrics (15, 16) was then applied to DAPI, X-probe (green), and Y-probe (orange) fluorescence channels on 2,917 cores (see Core image quality control in Methods). Of these, 1,000 cores (34.3% of 2,917) comprising 226 cores from CSMC-A (35% of that source), 56 from COM-M (13%), 9 from COM-FT (16%), 129 from UVA (45%), 105 from UCSF (17%), 41 from CHTN (19%), and 434 from CSMC-B (65%) passed quality control and were retained for mLOY analysis. Next, we implemented an automated pipeline for image processing of these 1,000 cores; nuclei were segmented using the StarDist neural network model, and then FISH signals were identified using the fast radial symmetry (FRST) detector (17, 18). The number of nuclei per core ranged from 102 to 23,598, totaling 4,327,315 nuclei from 1,000 cores. These signals were used to generate a quantitative FISH-based mLOY score (YchrFISH) for each core defined as the ratio of orange (Y-probe) to green (X-probe) spots detected by FRST across all nuclei in each core image (Figure 1, A–C), in essence, the Y/X spot ratio across all nuclei.
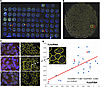
Positive correlation between FISH-based chromosome Y score (YchrFISH) and bFigure 1

Positive correlation between FISH-based chromosome Y score (YchrFISH) and bulk RNA-seq–based chromosome Y score (YchrRNA) in paired TMA and frozen tumor samples of metastatic prostate cancer. (A) FISH-stained TMA (1–3 cores per site). Boxes represent areas used as example in C. (B) Low magnification of 1 representative core with automatically detected and delineated nuclei and detected FISH spots. (C) Micrographs of example FISH staining of 3 representative cores of soft tissue: liver (1), lymph node (2), and omental (3) metastases (left) with corresponding FISH spots detected and nuclei delineated (right). Scale bars: 10 μm. (D) Linear regression modeling (red line) indicates a statistically significant fit (P = 0.0012) between the YchrRNA and YchrFISH scores (n = 25, Pearson’s r = 0.61). Significance was assessed using a t test. Chromosomes Y and X detected in nuclei are marked orange and green, respectively.

To validate the YchrFISH quantification method, we compared YchrFISH scores of 25 metastatic prostate cancer specimens with a transcriptomic surrogate, the Y-chromosome expression score (YchrRNA) calculated using previously described methodology applied on RNA-seq, computed from bulk RNA-seq of matched OCT-frozen tumor samples (19). We observed a strong correlation (Pearson’s r = 0.61, P = 0.0012), indicating that in the paired tissue samples, the YchrFISH score closely tracks with Y-chromosome dosage at the transcriptional level reflected by YchrRNA score (Figure 1D).

LOY is highly variable across tumor types. The degree of mLOY, as measured by the YchrFISH score, varied markedly across 324 carcinoma samples from 11 distinct tissue types (Figure 2A). A higher YchrFISH score indicates a higher retention rate of Y chromosome and thus less mLOY. The lowest levels of mLOY (highest median YchrFISH scores) were observed in bladder (median score ≈ 0.75), hepatobiliary, (≈ 0.73), and kidney (≈ 0.67) cancers. In contrast, stomach (≈ 0.49), lung (≈ 0.47), pancreas (≈ 0.23), head-and-neck (≈ 0.45), esophageal (≈ 0.34), and colorectal (≈ 0.20) cancers displayed the lowest Y-chromosome signals, indicating the most substantial mLOY. Intermediate scores were seen in prostate cancer (≈ 0.61). These data indicate that mLOY is not uniform across cancer but instead reflects tissue-specific patterns.
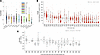
Degree of Y chromosome loss across male-derived cancer and normal tissues fFigure 2

Degree of Y chromosome loss across male-derived cancer and normal tissues from different organs. (A) YchrFISH scores across multiple cancer types. One data point represents 1 individual. Cancer types are ordered by descending median YchrFISH score. (B) Absolute Y-chromosome RNA signature (YchrS) in male-proxy primary TCGA tumors. Each dot represents 1 tumor sample; boxes show the interquartile range and median. Cancer types are ordered from high to low median tumor YchrS to facilitate comparison with YchrFISH in A. Higher scores indicate greater Y-chromosome RNA signal, corresponding to less inferred Y loss. Sample sizes are shown under each cancer-type label. Across 28 cancer types, the highest median tumor YchrS was observed in thymoma (THYM), prostate adenocarcinoma (PRAD), and diffuse large B cell lymphoma (DLBC), and the lowest in kidney chromophobe (KICH), rectum adenocarcinoma (READ), and kidney renal papillary cell carcinoma (KIRP), among 3,869 primary tumors total. (C) Paired ΔYchrS, calculated as tumor minus matched normal tissue, for cancer types with tumor-normal pairs from the same patient. Gray dots represent individual paired patients; the dashed horizontal line marks zero. Negative ΔYchrS values indicate lower Y-chromosome RNA signal in tumor relative to matched normal. Only cancer types with paired normal tissue are shown; n denotes the number of paired patients. Cancer-type order matches B where applicable. Statistical testing for C is provided in the Supporting Data Values file using paired Wilcoxon signed-rank tests per cancer type.

To compare this tissue-specific ranking, we analyzed RNA-seq–based mLOY scores (YchrS) derived from the paired tumor and normal samples in The Cancer Genome Atlas (TCGA). Figure 2B ranks 28 cancer types according to the median tumor YchrS score across 3,869 tumor samples from 3,868 unique patients (one patient had 2 primary tumor samples). For the 298 tumor-normal sample pairs with known cancer type, we then calculated ΔYchrS as the absolute difference between tumor and matched normal YchrS scores. Additional 87 pairs lacking cancer type information were not included in this analysis. The median ΔYchrS was negative in 16 of 19 cancer types with paired samples (Figure 2C), indicating lower YchrS in tumors than in matched normal tissue. This decrease was statistically significant in 7 cancer types (P < 0.05; see Supporting Data Values file).

Chromosome Y gain is associated with increased expression of Y-linked genes. Using YchrRNA, YchrS scores, and matched tumor–normal data, we tested whether tumors with chromosome Y gain show elevated expression of Y-linked genes. Analysis of differential expression (log2[fold change]; log2FC) revealed 8 Y-linked genes to be significantly (false discovery rate–adjusted P values; PFDR) upregulated in Gain tumors versus normal tissue (PFDR < 0.05, log2FC > 0): TMSB4Y (log2FC = 51.14, PFDR = 0.0077), DAZ2 (log2FC = 33.89, PFDR = 0.0077), TBL1Y (log2FC = 13.16, PFDR = 0.0158), EIF1AY (log2FC = 207.66, PFDR = 0.0486), NLGN4Y (log2FC = 63.90, PFDR = 0.0486), DAZ1 (log2FC = 285.19, PFDR = 0.0486), SRY (log2FC = 6.27, PFDR = 0.0486), and AMELY (log2FC = 1.06, PFDR = 0.0486). No Y-linked genes showed significant downregulation (Supplemental Figure 1 and Supporting Data Values file; supplemental material available online with this article; https://doi.org/10.1172/jci.insight.201996DS1).

mLOY is associated with reduced PAR1 and PAR2 gene expression. Pseudoautosomal regions (PAR1 and PAR2) are short regions of homology between the mammalian X and Y chromosomes and behave like an autosome during meiosis. Because PAR1 and PAR2 genes reside on both the X and Y chromosomes and normally require 2 active copies in males, we examined whether mLOY disrupts their dosage-sensitive expression. PAR genes escape X-inactivation and are therefore expected to show reduced transcript levels when the Y-linked allele is lost. To determine whether mLOY leads to measurable transcriptional consequences beyond canonical Y-linked genes, we quantified PAR1, PAR2, and combined PAR expression across tumors stratified by Y-chromosome status. Analysis revealed that mLOY is associated with significantly reduced PAR1 (P < 0.001) and PAR-combined expression (P < 0.001) versus WT, and a weaker but detectable reduction in PAR2 expression (P = 0.065) (Supplemental Figure 2, A, C, and E). Across the 6 Y-chromosome status groups — WT, mLOY, partial loss of Y (pLOY), remaining loss of Y (rLOY), chromosome Y gain (Gain), or mixed gain/loss (Gain_Loss) — significant differences in PAR1 (P < 0.001), PAR2 (P < 0.046, with WT showing the highest median and widest range), and combined PAR expression (P < 0.001) were observed (Supplemental Figure 2, B, D, and F).

Age-associated changes in YchrFISH scores. Analysis of age-associated changes in YchrFISH scores reveals a tissue-context-dependent relationship between aging and mLOY (Supplemental Figure 3). A significant negative correlation with age was observed in histologically normal tissues from men with cancer, both in organs distant from the tumor [NM(inCA), r = –0.447, P < 0.001] and in epithelium adjacent to cancer [NM(adCA), r = –0.306, P < 0.05], whereas no such association was detected in tissues from cancer-free men or in carcinoma samples.

YchrFISH score decreases progressively from normal to cancer. Using the YchrFISH score, we profiled 1,000 male tissue cores from 5 groups as mentioned above: FT (n = 9 male donors), NM(noCA) (n = 53 individuals), NM(inCA) (n = 10 individuals), NM(adCA) (n = 68 individuals), and CA (n = 321 individuals). YchrFISH scores were tightly centered near unity in FT and loosely centered at 1 in NM(noCA), consistent with a diploid baseline. The median levels of YchrFISH scores in NM(inCA) and NM(noCA) were similar, while NM(adCA) showed a significant decrease from NM(inCA), indicating increased mLOY in normal-appearing tissues adjacent to the tumor (Figure 3A). CA displayed the lowest YchrFISH scores with the broadest dispersion, consistent with strong mLOY enrichment in malignant epithelium. The median YchrFISH score differed significantly between NM(noCA) and NM(adCA) (P < 0.01), as well as between NM(inCA) and NM(adCA) (P < 0.01). In contrast, none of the comparisons between NM(noCA) and NM(inCA) overall or within individual organ types, differed significantly (Wilcoxon’s rank-sum test, P > 0.718) (Figure 3, A and B, and Supplemental Table 1; distribution of tissue types across individuals is shown in Figure 3C). These findings support a progressive increase in mLOY from normal through adjacent epithelium to carcinoma. Importantly, mLOY in cancer patients was limited to the organs with malignant transformation.

LOY increases progressively from normal to adjacent to malignant epitheliumFigure 3

LOY increases progressively from normal to adjacent to malignant epithelium. (A) Distribution of organ-level FISH-derived LOY (YchrFISH) scores obtained from analysis of 1,000 TMA cores from 405 individuals (Table 1). One circle represents 1 organ-level YchrFISH score. Tissues are stratified into 5 types: fetal tissue (FT), histologically normal tissue from cancer-free individuals [NM(noCA)], histologically normal tissue from cancer patients sampled from a non-malignant organ [NM(inCA)], histologically normal epithelium adjacent to carcinoma [NM(adCA)], and carcinoma (CA). Statistical analysis was carried out using the Wilcoxon rank-sum test. (B) YchrFISH scores in NM(noCA) and NM(inCA) derived from colon and rectum (n = 18 and n = 8 individuals, respectively) juxtaposed with YchrFISH scores from 10 other organs (n = 69 and n = 45 individuals, respectively). The organ-level YchrFISH scores in NM(noCA) tissue and NM(inCA) tissue originate from 53 and 10 individuals, respectively. A summary of the number of analyzed samples, stratified by organ, tissue type and match status can be found in Supplemental Table 1. Statistical analysis was carried out using the Wilcoxon rank-sum test. (C) Venn diagram showing the distribution of tissue types across individuals (n = 405). FT, NM(noCA), NM(inCA), NM(adCA), and CA samples spanned major organs and included tissues from multiple organs obtained from the same individual. Among 321 men with cancer, 49 contributed paired same-organ CA and NM(adCA) tissue samples. Three of the 321 cancer-bearing men had cancer in 2 major organs resulting in 324 organ-level CA YchrFISH scores presented in Figure 3A. Additional paired NM(adCA) and CA samples (i.e., without paired tissue from the same organ) originated from 18 and 267 men, respectively. Fetal tissues from multiple organs (FT; n = 9 donors) served as reference groups in the analysis.

mLOY is present in normal tissues adjacent to cancer. We further examined whether the degree of mLOY was elevated in histologically normal adjacent epithelium in different cancer types (Figure 4). In our TMAs, sufficient samples for tumor-type-specific analysis of tumor and adjacent normal tissue were only available for bladder and prostate carcinoma. Cancers with less than 5 samples (colon and rectum, lung, liver and bile duct, pancreas, esophagus and stomach) were pooled into an “Others” group. In this subset of samples, YchrFISH scores were consistently lower in CA compared with NM(adCA) (Figure 4A), indicating greater mLOY in tumor epithelium. The most pronounced separation was observed in prostate, with median YchrFISH scores of 0.749 in NM(adCA) and 0.624 in CA. The aggregated “Others” group showed a larger discrepancy, with median scores of 0.949 in NM(adCA) and 0.517 in CA, reflecting approximately equal detection of X and Y chromosomes in adjacent normal epithelium versus an approximately 50% reduction in Y chromosome detection relative to X in carcinomas. The smallest downward shifts were seen in bladder, with median NM(adCA) versus CA scores of 0.837 versus 0.752. Across all 8 organs, mLOY rates differed significantly between NM(adCA) and CA tissues in both paired samples (Figure 4B, P < 0.001) and the combined paired and unpaired dataset (Supplemental Figure 4; “Others”, P < 0.01). These findings suggest that the extent of mLOY in the “pre-neoplastic field” is not directly proportional to the degree of mLOY in the corresponding malignancies, suggesting that progressive accumulation of mLOY in normal cells is not uniform across organ types.

Comparison of YchrFISH scores between matching carcinoma (CA) and adjacentFigure 4

Comparison of YchrFISH scores between matching carcinoma (CA) and adjacent normal [NM(adCA)] across different organs. (A) Paired analysis (same organ) YchrFISH scores demonstrates lower YchrFISH scores in carcinomas than in their matched adjacent normal tissues, including bladder (n = 33 individuals), prostate (n = 8 individuals), and other organs (colon, liver, lung, pancreas, rectum, and stomach) combined (n = 8 individuals). Statistical significance was assessed using the Wilcoxon signed-rank test. Cancer types represented by ≤2 paired samples (colon, liver, lung, pancreas, rectum, and stomach) were combined into a single “other organs” group because individual statistical analyses were not informative. (B) Combined analysis of all paired samples (n = 49 individuals). Half-violin plots show the distribution of YchrFISH scores in NM(adCA) and CA samples. The overall difference between paired samples was significant (paired Wilcoxon signed-rank test, P = 0.00051). A summary of the number of analyzed samples, stratified by organ, tissue type, and match status can be found in Supplemental Table 1.

Evidence for progressive Y-chromosome loss in transformation and progression. To complement the FISH-based findings above, we leveraged whole-organ RNA-seq maps (20, 21) that profiled spatially resolved urothelial samples within individual cystectomy specimens. We applied a published Y-chromosome expression signature (22), together with curated Y-linked gene sets on these samples to systematically assess transcriptional surrogates of mLOY. YchrRNA scores in regions classified as histologically low-grade intraepithelial neoplasia (LGIN) and high-grade intraepithelial neoplasia (HGIN) were compared with urothelial carcinoma scores. This analysis revealed a decline in YchrRNA scores within the same organ, with male epithelium exhibiting higher LGIN+HGIN YchrRNA score values than in invasive carcinoma (P = 0.059) (Figure 5A).

Reduced Y-chromosome RNA signature during urothelial transformation.Figure 5

Reduced Y-chromosome RNA signature during urothelial transformation. (A) YchrRNA scores derived from spatially mapped low-grade (LGIN) and high-grade (HGIN) intraepithelial lesions matched with invasive bladder carcinoma (Cancer) in 5 individuals (M18, M19, M21, M22, and M23); data were retrieved from Bondaruk et al. and Majewski et al. (20, 21). Because matched, consistently annotated normal urothelium was not available in sufficient numbers from these same LGIN/HGIN cystectomy-map cases, the paired analysis was restricted to LGIN/HGIN and invasive carcinoma. Each dot represents the individual-level average YchrRNA score from the indicated color-coded pathological category: LGIN+HGIN (n = 58 and 43 samples) and Cancer (n = 15 samples). The analysis was performed using the paired Wilcoxon signed-rank test. (B) Heatmap of representative Y-linked genes in an independent cohort (23) including normal urothelium (n = 9), Ta/T1 tumors without carcinoma in situ (CIS) (n = 15), Ta/T1 tumors with CIS (n = 13); and invasive bladder cancers (n = 13), and each row to a Y-linked gene. Expression levels are shown as row-scaled z scores (red = higher expression, white = median, blue = lower expression).

These findings were consistent with expression data from Dyrskjøt et al. (23), which profiled bladder tumors and urothelium across pathological stage and the presence of CIS. Our reanalysis of these data revealed a coordinated downward shift in the expression of multiple Y-linked genes, including USP9Y, DDX3Y, KDM5D, UTY, ZFY, and TBL1Y. Heatmap visualization demonstrated that these transcripts attenuated in parallel with disease progression (Figure 5B). Together, these results extend our paired-core FISH-based analyses by showing that at the transcriptomic level mLOY progresses from noninvasive carcinoma to invasive disease. These findings support the concept that mLOY occurs in early lesions and is an escalating event in bladder tumor progression.

Discussion

mLOY has been frequently observed in the blood of healthy aging men (1). mLOY has also been reported in skin (24), brain (25), bone marrow (26), cheek swabs (buccal cells) (1, 27, 28), and urine (29, 30) specimens. A recent scDNA-seq study of 102 nuclei from lung and colon tissues of a 74-year-old male presented enormous mLOY heterogeneity across organs and cells (31). The clinical relevance of these to patient outcomes and to blood mLOY remain to be determined. By showing an association between mLOY in histologically normal tissue adjacent to cancer but not in organs uninvolved with tumors, our pan-organ analysis provides the rationale for the concept that mLOY in non-tumorigenic tissues is an early event in transformation. Our work also supports the contention that mLOY is not a “passenger biomarker” of aging, but a direct pathogenic driver of age-related diseases in males (22, 32).

Three principal insights emerge that reshape our understanding of mLOY in oncogenesis. First, the current study reveals a stepwise accumulation of mLOY that parallels transformation and tumor progression. This was corroborated by independent transcriptomic analyses of spatially resolved bladder cystectomy maps supporting the presence of a continuous mLOY field effect during tumor evolution (20). Complementary differential expression analyses further showed that tumors classified as having chromosome Y gain exhibit significant upregulation of multiple Y-linked genes relative to matched normal tissues, confirming that increased Y-chromosome dosage translates directly into elevated Y-gene expression. Analysis of paired tumor-normal samples from TCGA revealed reduced expression of pseudo autosomal region genes (PAR1 and PAR2) in tumors, consistent with consequences of Y-chromosome loss. Concordance between genomic (FISH) and transcriptional (RNA-seq) readouts supports the model of mLOY as a robust, early, and common somatic alteration in solid-tissue oncogenesis, defining a “pre-neoplastic LOY field effect” that precedes overt morphological malignancy (33, 34).

Second, our findings strongly suggest that this mLOY field effect has direct pathological consequences. mLOY in men with chronic kidney disease is associated with significantly increased risk of mortality and heart failure, identifying a high-risk subgroup for adverse cardiovascular outcomes (35). The present study expands this concept in oncology, revealing more mLOY in normal tissues adjacent to cancer compared with cancer-free individuals and normal tissue from individuals with cancer in another tissue. This suggests that a common pathogenic mechanism may be at play; Y chromosome–deficient immune or stromal cells, regardless of their location, may create a profibrotic (36) and proinflammatory microenvironment that is permissive for either tissue remodeling, as in the heart, or for malignant transformation.

Third, the striking tissue specificity of mLOY in cancer implies that local factors determine the ultimate pathological outcome of mLOY. While hematopoietic loss of Y chromosome leads to cardiac fibrosis and heart failure mortality (37), our current data show that within organs such as the bladder and prostate the primary consequence appears to be malignant transformation. This suggests that intrinsic, lineage-specific factors perhaps related to local immune surveillance or tissue-specific transcriptional networks modulate the response to mLOY, dictating whether the outcome is fibrotic disease or cancer. The enrichment of mLOY in tumors compared with adjacent normal tissue further argues that these clones are under active positive selection during carcinogenesis and progression.

Fourth, finding a negative correlation with age in histologically normal tissues from men with cancer either adjacent to the tumor or in organs distant from the tumor but not in men without cancer is conceptually aligned with finding that PBMC mLOY is associated with cancer development. We can speculate that age-related mLOY within histologically normal compartments is not a universal feature of male somatic tissues but preferentially manifests and drives cancer risk. The presence of age-associated mLOY in tissues distant from the tumor supports a systemic predisposition to Y-chromosome instability in cancer-bearing individuals, while its enrichment in tumor-adjacent normal tissue is consistent with field effects. In contrast, the lack of a detectable age correlation in carcinomas suggests that mLOY dynamics in tumors are shaped by clonal selection and additional genomic alterations, obscuring linear age-dependent trends. Together, these results support a model in which mLOY in PBMCs reflects genomic vulnerability linked to cancer risk by indirectly reporting the presence of mLOY in specific somatic tissues, the latter ultimately predisposing the cells to transformation. This model does not exclude the likely important contribution of specific PBMC populations with LOY to promote established progression once a tumor is established (32).

While our study is limited by its reliance on archival tissue from TMA slides with limited sample quantity, which may not always be representative of the entire heterogeneous tumor, the breadth of our analysis provides a crucial bridge between organ-specific pathology and systemic mosaicism. While no precursor lesions or malignant components were present in the normal tissue cores, including NM(adCA) and NM(inCA), we acknowledge that malignant cores contained normal stroma and inflammatory cells. As a result, the mLOY rate may be underestimated in malignant TMA cores due to the presence of non-malignant components. We also acknowledge that within normal samples, stromal, immune, and epithelial cells might have been present, potentially affecting the YchrFISH scores calculated for these samples. This critique is somewhat mitigated by the finding that normal cells infiltrating the tumor microenvironment also have mLOY (32). Our observation of mLOY occurring in early bladder lesions as an escalating event in bladder tumor progression warrants further investigation, given the small number of paired normal tissue samples. Future single-cell and spatial technologies will determine the relationships between LOY cells and their neighbors and how that relates to patient outcome.

In conclusion, by placing our pan-cancer findings in the context of prior mechanistic work on mLOY (20), we provide compelling evidence that positions mLOY in benign cells as a fundamental driver of male-specific carcinogenesis. This unified view provides a fresh perspective and working model of why aging men are more susceptible to cancer, establishing mLOY as a key therapeutic, diagnostic, and prevention target. These findings pave the way for targeted interventions, such as early detection followed by approaches to prevent Y-chromosome loss or eliminate normal or premalignant cells with mLOY.

Methods

Sex as a biological variable. Because mLOY is a male-specific phenomenon, only tissues from individuals assigned male at birth were included in analyses of mLOY by immunofluorescence. Female samples were used only as negative controls to confirm assay specificity. Within the male cohort, analyses were stratified by organ. Sex was therefore an intrinsic biological variable in study design, and its consideration was essential both for assay validation and for result interpretation.

TMA slide preparation, staining, and imaging. This study analyzed 30 TMAs containing malignant (CA) and normal (NM) tissue samples collected from individuals with and without cancer. The TMAs were constructed using malignant and normal tissue sourced from the CSMC Biobank (autopsy and bladder; 13 TMAs), a commercial vendor (multiorgan and fetal tissue; 7 TMAs from https://tissuearray.com/), and collaborating institutions (multiorgan, prostate, and colon; 10 TMAs from USCF, UVA, and CHTN). Normal tissue cores were categorized into 4 groups: (a) NM(noCA), (b) NM(inCA) with NM and CA from different organs, (c) NM(adCA) from the same organs, and (d) normal FT, collectively accounting for 2,917 cores (Table 1). The TMAs were reviewed by an experienced genitourinary pathologist. No precursor lesions or malignant components were present in the normal tissue cores, including NM(adCA) and NM(inCA). Clinicopathological parameters, including sex (male or female), age, organ site, and tissue categories were cross-referenced with the YchrFISH scores for statistical analysis. Additionally, 2 rapid autopsy metastatic prostate cancer TMAs from the University of Washington (UW, 96 cores of metastases from 16 individuals across 15 metastatic sites collected by the Prostate Cancer Donor Program) and corresponding bulk RNA-seq data from paired OCT-frozen tumor samples (19) were used to validate the FISH assay (see mLOY score quantification and validation).

Freshly sectioned TMA slides (4 μm or 5 μm thick) were processed for FISH assay. Following deparaffinization, the TMA sections were stained using the AneuVysion Multicolor DNA Probe Kit (CE) (PROBE MIXTURE 1, Abbott Laboratories, 05J38-050), adhering to the manufacturer’s guidelines, and counterstained with DAPI. This kit employs FISH probes to detect α satellite DNA in the centromeres of chromosome Y (Yp11.1-q11.1, orange fluorescence) and chromosome X (Xp11.1-q11.1, green fluorescence) and is designed for karyotyping in amniotic fluid samples and FFPE specimens (38). TMA slide imaging was performed immediately after staining utilizing the ZEISS Axio Scan.Z1 scanner equipped with a Plan-Apochromat 20×/0.8 NA magnification objective and a Hamamatsu Orca Flash camera. The scanner captured 16-bit monochromatic images with the pixel size of 0.326 μm × 0.326 μm for each staining layer. The complete TMA slide image, including DAPI and FISH (orange and green) layers, was saved as a single.czi file.

TMA slide image de-arraying. The whole-slide TMA image was then loaded up and processed using the TMA de-array software tool (39) to automatically detect individual core images and assign unique coordinates to each core image. After manual inspection, corrections were made to add missing cores, remove cores with folded tissue, and improperly detected cores. Final core images were then extracted and saved as 3-layer (DAPI, green, orange) TIFF files. Coordinates of these images were cross-referenced with TMA documentation to exclude control and female tissue cores during downstream analysis.

Core image quality control. To identify FISH spots, the quality of staining in the green and orange core images was evaluated using the Rose contrast-to-noise (CNR) criterion. The CNR was calculated as CNR = (Ms – Mb)/σb, where Ms is the mean intensity of FISH spot pixels, and Mb and σb represent the mean and standard deviation of pixels within the nucleus, excluding the spot. According to this criterion, spots with a CNR below 3 to 5 are challenging to observe (15, 16). A similar calculation was performed for DAPI images. Here, nuclear pixel intensities used for Ms and pixel intensities outside the nucleus used for Mb and σb. To evaluate the quality of the entire core image, CNRs were calculated separately for the orange, green, and DAPI layers using pixels from 10 randomly selected nuclei, each containing at least 1 FISH spot per color. The CNRs were then averaged within each layer. Core images were adequate for subsequent analyses only if the average CNR for each layer exceeded 5. Core images not meeting this criterion were excluded.

Cell nuclei segmentation and FISH spot detection. To automate mLOY quantification, we used previously developed image processing techniques to provide a nuclear mask, and a spot mask for tissue images stained using the FISH assay. For core images adequate for this analysis, the nuclear mask was obtained through StarDist, a publicly available neural network model that identified and delineated nuclei in the DAPI image (40). To obtain FISH spot masks, the Fast Radial Symmetry–based (FRST-based) FISH spot detector (17, 18) was applied separately to the orange and the green image. Prior to detecting spots, the orange and green images were preprocessed by the Gaussian filter to flatten the background, and subsequently by the anisotropic diffusion filter (41) to attenuate debris and nonspecific FISH staining. By providing a range of spot radii (in pixels), the FRST-based detector detected spots with matching radii. The range of matching radii was established based on the minimum (~0.35 μm, 1 pixel) and the maximum (~0.78 μm, 2 pixels) spot radius found in the orange and green images. Additionally, by setting up the radial strictness parameter α to 2, FRST detected circular spots and omitted oval and elongated spots that would require a higher α value set for their detection. As a result, FRST outputs an intensity image with peaks indicating the positions of detected spots. Thresholding this image using a cutoff value calculated as described in Gertych et al. and Bahry et al. (17, 18) yielded a binary spot mask. For visualization, the detected spots were marked by crosshairs (Figure 1, C right column, and D inset).

mLOY score quantification and validation. The FISH-assay based YchrFISH score was calculated for each TMA core as the ratio of orange to green FISH spots detected under the nuclear mask. To evaluate adequacy of the FISH assay for mLOY quantification in our TMAs, the FISH-based mLOY scores were compared to the bulk RNA-seq–based mLOY scores from OCT-frozen tumor samples in metastatic prostate cancer specimens from UW (19). A total of 77 TMA core images from 25 tumors passed quality control and were used for regression analysis. The YchrFISH scores of TMA cores punched from the same specimen/tumor were averaged. The null hypothesis was that there is no significant association between the FISH- and RNA-seq–based mLOY scores.

Gene-level analysis. To compare YchrFISH scores with RNA-seq–based mLOY scores (YchrS), we analyzed primary tumor samples and paired tumor and matched normal samples from male-proxy primary tumors in the TCGA Pan-Cancer RNA-seq matrix (42). To perform the analysis, we defined the YchrS score as the mean log2 expression of the 9 Y-chromosome genes (DDX3Y, UTY, KDM5D, USP9Y, ZFY, RPS4Y1, TMSB4Y, EIF1AY, and NLGN4Y) from Chen et al. (32) and analyzed cases spanning 28 cancer types. Male samples were determined based on a YchrS score cutoff of 0.5 or greater. For the paired analysis, we identified those male individuals who had both a tumor and a matched normal sample, spanning 19 cancer types and calculated ΔYchrS as tumor YchrS minus paired solid-tissue normal YchrS.

Additionally, analysis of RNA expression of PAR1 and PAR2 (pseudoautosomal region) genes that are present on both the X and Y chromosomes was performed to assess whether the expression of this gene set is altered in mLOY tissues. To directly test whether loss of the mLOY alters expression of PAR genes — which reside on both X and Y chromosomes and are expected to be dosage sensitive in males — we quantified RNA expression of PAR1 and PAR2 gene sets in the TCGA cohort using the same bulk RNA-seq matrix employed for the YchrRNA/YchrS analyses. For this analysis, we defined PAR1 and PAR2 scores as the mean log2 expression of each gene, and the PAR combined score was defined as the mean expression of PAR1 and PAR2 genes. Samples were stratified by tumor Y-chromosome status into 6 categories: WT, mLOY, pLOY, rLOY, Gain, or Gain_Loss, as determined by the whole-genome sequencing (WGS) and FACETS copy-number analysis adopted from Qi et al. (9) (Supplemental Methods).

Spatial RNA-seq dataset acquisition. Spatially resolved bladder RNA-seq data were obtained from the cystectomy map resource of Bondaruk et al. and Majewski et al. (20, 21), which provides grid-defined transcriptomic profiles across histologically annotated urothelial regions. Each sample is annotated as LGIN or HGIN, or invasive carcinoma (Cancer), and enabling within-organ comparisons between LGIN+HGIN versus Cancer that minimize interpatient variability.

Bladder cancer dataset. We reanalyzed expression profiles from the bladder cancer microarray dataset from 5 individuals reported by Dyrskjot et al. (23). This dataset includes samples spanning histologically normal urothelium, CIS, superficial tumors, and muscle-invasive tumors. Probes corresponding to Y-linked genes (USP9Y, DDX3Y, KDM5D, UTY, ZFY, TBL1Y, and others) were extracted, normalized, and visualized as heatmaps as previously described (32). Expression heatmaps were generated using variance-stabilized counts, with rows representing genes and columns representing samples ordered by pathological stage (normal → Ta/T1 without CIS → Ta/T1 with CIS → Invasive Cancer). Relative expressions were scaled per gene, and color values represent standardized expression (red = higher, blue = lower, white = median).

Statistics. All statistical analyses of YchrFISH scores were performed at the individual level. When multiple tissue cores were available from the same individual and organ, values were averaged prior to analysis. Paired statistical tests were used when comparing different tissue types obtained from the same individual. Group comparisons were performed using the Wilcoxon rank-sum test or paired Wilcoxon signed-rank test. The Kruskal-Wallis test was used to evaluate differences between 3 or more independent groups. All tests were 2-sided, and statistical significance was defined at a threshold of P less than 0.05 unless otherwise specified. Correlation analyses were conducted using Pearson’s correlation and t test. Violin and half-violin plots were used to visualize YchrFISH score distributions. Statistical significance in differential gene expression analysis was determined using Wald’s test, and P values were corrected for multiple testing using the Benjamini-Hochberg (BH) FDR, with adjusted P values (PFDR) reported throughout. The BH P-value adjustment was carried out based on their rank rather than their absolute magnitude. Hence, genes with similar or identical raw P values received the same PFDR value. The BH method produced stepwise adjusted values, which can cause groups of genes — especially those with similar expression patterns — to share identical corrected P values. Genes with PFDR less than 0.05 were considered significantly differentially expressed. Log2FC values were used to quantify differential gene expression, with positive log2FC indicating upregulated genes and negative log2FC indicating downregulated genes. Linear regression modeling was used to assess significance of association between the Y-chromosome expression score (YchrRNA) and the FISH-based mLOY score (YchrFISH), and to visualize correlation between YchrFISH and age across different tissue types. Significance was assessed using a t test. In box-and-whisker plots, boxes indicate the interquartile range (IQR), horizontal lines within boxes denote the median, and whiskers extend to 1.0 × IQR.

Study approval. The data collection and analysis were approved for research by the Cedars-Sinai Institutional Review Board under project number Pro000043021.

Data availability. The data supporting the findings of this study are available within the article. Values for all data points in graphs and average FISH score values per case/tumor are reported in the Supporting Data Values file. Supporting analytic code is available upon request.

Author contributions

DT conceptualized the idea and hypothesis and initiated the study. AG, HY, XC, EV, and VKR developed the methodology, acquired data, performed analyses, and generated graphs. HY provided pathological expertise and reviewed TMAs. LB, LDT, PSN, and PRC provided reagents and advice. AG, HY, XC, and DT wrote and revised the manuscript.

Conflict of interest

The authors have declared that no conflict of interest exists.

Funding support

This work is the result of NIH funding, in whole or in part, and is subject to the NIH Public Access Policy. Through acceptance of this federal funding, the NIH has been given a right to make the work publicly available in PubMed Central.

  • National Cancer Institute grant R35CA294022 to DT.
  • Pacific Northwest Prostate Cancer SPORE grant P50CA97186.
  • NIH program project grant P01CA163227 to PSN.
  • Institute for Prostate Cancer Research grant to LDT and PSN.
Supplemental material

View Supplemental data

View Supporting data values

Acknowledgments

The authors thank the Biobank and Research Pathology Resource core at Cedars-Sinai Medical Center for slide scanning. We also acknowledge the rapid tissue collection teams for their contributions to the UW Prostate Cancer Donor Program.

Address correspondence to: Dan Theodorescu, University of Arizona Comprehensive Cancer Center, University of Arizona, 1515 North Campbell Ave., Tucson, Arizona, 85724, USA. Phone: 520.694.2873; Email: theodorescu@arizona.edu.

Footnotes

Copyright: © 2026, Gertych et al. This is an open access article published under the terms of the Creative Commons Attribution 4.0 International License.

Reference information: JCI Insight. 2026;11(17):e201996.https://doi.org/10.1172/jci.insight.201996.

References
  1. Forsberg LA. Loss of chromosome Y (LOY) in blood cells is associated with increased risk for disease and mortality in aging men. Hum Genet. 2017;136(5):657–663.
    View this article via: CrossRef PubMed Google Scholar
  2. Dumanski JP, et al. Mosaic loss of chromosome Y in blood is associated with Alzheimer disease. Am J Hum Genet. 2016;98(6):1208–1219.
    View this article via: CrossRef PubMed Google Scholar
  3. Dirican CD, Nelson PS. Y Chromosome loss and implications for oncology. Mol Cancer Res. 2024;22(7):603–612.
    View this article via: CrossRef PubMed Google Scholar
  4. Loftfield E, et al. Mosaic Y loss is moderately associated with solid tumor risk. Cancer Res. 2019;79(3):461–466.
    View this article via: CrossRef PubMed Google Scholar
  5. Noveski P, et al. Loss of Y chromosome in peripheral blood of colorectal and prostate cancer patients. PLoS One. 2016;11(1):e0146264.
    View this article via: CrossRef PubMed Google Scholar
  6. Wright DJ, et al. Genetic variants associated with mosaic Y chromosome loss highlight cell cycle genes and overlap with cancer susceptibility. NatGenet. 2017;49(5):674–679.
    View this article via: PubMed CrossRef Google Scholar
  7. Zhou W, et al. Mosaic loss of chromosome Y is associated with common variation near TCL1A. Nat Genet. 2016;48(5):563–568.
    View this article via: CrossRef PubMed Google Scholar
  8. Muller P, et al. Why loss of Y? A pan-cancer genome analysis of tumors with loss of Y chromosome. Comput Struct Biotechnol J. 2023;21:1573–1583.
    View this article via: CrossRef PubMed Google Scholar
  9. Qi M, et al. Loss of chromosome Y in primary tumors. Cell. 2023;:S0092-8674(23)00646-3.
    View this article via: PubMed CrossRef Google Scholar
  10. Stankowska W, et al. Tumor predisposing post-zygotic chromosomal alterations in bladder cancer-insights from histologically normal urothelium. Cancers (Basel). 2024;16(5):961.
    View this article via: CrossRef PubMed Google Scholar
  11. Jordan JJ, et al. Loss of the short arm of the Y chromosome in human prostate carcinoma. Cancer Genet Cytogenet. 2001;124(2):122–126.
    View this article via: CrossRef PubMed Google Scholar
  12. Agahozo MC, et al. Loss of Y-chromosome during male breast carcinogenesis. Cancers (Basel). 2020;12(3):631.
    View this article via: CrossRef PubMed Google Scholar
  13. Evans MI, et al. Automated microscopy of amniotic fluid cells: detection of FISH signals using the FastFISH imaging system. Fetal Diagn Ther. 2006;21(6):523–527.
    View this article via: CrossRef PubMed Google Scholar
  14. Pailler E, et al. High level of chromosomal instability in circulating tumor cells of ROS1-rearranged non-small-cell lung cancer. Ann Oncol. 2015;26(7):1408–1415.
    View this article via: CrossRef PubMed Google Scholar
  15. Dieckens D, et al. Contrast-noise-ratio (CNR) analysis and optimisation of breast-specific gamma imaging (BSGI) acquisition protocols. EJNMMI Res. 2013;3(1):21.
    View this article via: CrossRef PubMed Google Scholar
  16. Gertych A, et al. Measuring topology of low-intensity DNA methylation sites for high-throughput assessment of epigenetic drug-induced effects in cancer cells. Exp Cell Res. 2010;316(19):3150–3160.
    View this article via: CrossRef PubMed Google Scholar
  17. Gertych A, et al. Rapid 3-D delineation of cell nuclei for high-content screening platforms. Comput Biol Med. 2016;69:328–338.
    View this article via: CrossRef PubMed Google Scholar
  18. Bahry E, et al. RS-FISH: precise, interactive, fast, and scalable FISH spot detection. Nat Methods. 2022;19(12):1563–1567.
    View this article via: CrossRef PubMed Google Scholar
  19. Brady L, et al. Inter- and intra-tumor heterogeneity of metastatic prostate cancer determined by digital spatial gene expression profiling. Nat Commun. 2021;12(1):1426.
    View this article via: CrossRef PubMed Google Scholar
  20. Bondaruk J, et al. The origin of bladder cancer from mucosal field effects. iScience. 2022;25(7):104551.
    View this article via: CrossRef PubMed Google Scholar
  21. Majewski T, et al. Understanding the development of human bladder cancer by using a whole-organ genomic mapping strategy. Lab Invest. 2008;88(7):694–721.
    View this article via: CrossRef PubMed Google Scholar
  22. Abdel-Hafiz HA, et al. Y chromosome loss in cancer drives growth by evasion of adaptive immunity. Nature. 2023;619(7970):624–631.
    View this article via: CrossRef PubMed Google Scholar
  23. Dyrskjot L, et al. Gene expression in the urinary bladder: a common carcinoma in situ gene expression signature exists disregarding histopathological classification. Cancer Res. 2004;64(11):4040–4048.
    View this article via: CrossRef PubMed Google Scholar
  24. Tang J, et al. The genomic landscapes of individual melanocytes from human skin. Nature. 2020;586(7830):600–605.
    View this article via: CrossRef PubMed Google Scholar
  25. Heim S, et al. Trisomy 7 and sex chromosome loss in human brain tissue. Cytogenet Cell Genet. 1989;52(3-4):136–138.
    View this article via: PubMed CrossRef Google Scholar
  26. Pierre RV, Hoagland HC. Age-associated aneuploidy: loss of Y chromosome from human bone marrow cells with aging. Cancer. 1972;30(4):889–894.
    View this article via: CrossRef PubMed Google Scholar
  27. Gonzalez JR, et al. MADloy: robust detection of mosaic loss of chromosome Y from genotype-array-intensity data. BMC Bioinformatics. 2020;21(1):533.
    View this article via: CrossRef PubMed Google Scholar
  28. Machiela MJ, et al. Mosaic chromosome Y loss and testicular germ cell tumor risk. J Hum Genet. 2017;62(6):637–640.
    View this article via: CrossRef PubMed Google Scholar
  29. Betz J, et al. FISH studies on the Y chromosome in male urinary cells. Cancer Genet Cytogenet. 1996;88(2):155–157.
    View this article via: CrossRef PubMed Google Scholar
  30. Meloni AM, et al. A new approach in the diagnosis and follow-up of bladder cancer. FISH analysis of urine, bladder washings, and tumors. Cancer Genet Cytogenet. 1993;71(2):105–118.
    View this article via: CrossRef PubMed Google Scholar
  31. Luquette LJ, et al. A comprehensive view of somatic mosaicism by single-cell DNA analysis [preprint]. https://doi.org/10.1101/2025.10.31.685648 Posted on bioRxiv November 3, 2025.
  32. Chen X, et al. Concurrent loss of the Y chromosome in cancer and T cells impacts outcome. Nature. 2025;642(8069):1041–1050.
    View this article via: CrossRef PubMed Google Scholar
  33. Altok M, et al. Chromosomal aberrations in benign prostatic hyperplasia patients. Investig Clin Urol. 2016;57(1):45–49.
    View this article via: CrossRef PubMed Google Scholar
  34. Jeong SY, et al. Loss of Y chromosome in the malignant peripheral nerve sheet tumor of a patient with neurofibromatosis type 1. J Korean Med Sci. 2010;25(5):804–808.
    View this article via: CrossRef PubMed Google Scholar
  35. Weyrich M, et al. Loss of Y chromosome and cardiovascular events in chronic kidney disease. Circulation. 2024;150(10):746–757.
    View this article via: CrossRef PubMed Google Scholar
  36. Bjurling J, et al. Mosaic loss of chromosome Y in blood is associated with male susceptibility for idiopathic pulmonary fibrosis. Commun Med (Lond). 2025;5(1):246.
    View this article via: CrossRef PubMed Google Scholar
  37. Sano S, et al. Hematopoietic loss of Y chromosome leads to cardiac fibrosis and heart failure mortality. Science. 2022;377(6603):292–297.
    View this article via: CrossRef PubMed Google Scholar
  38. Rivasi F, et al. FISH analysis in cell touch preparations and cytological specimens from formalin-fixed fetal autopsies. Diagn Cytopathol. 2008;36(9):633–636.
    View this article via: CrossRef PubMed Google Scholar
  39. Bankhead P, et al. QuPath: open source software for digital pathology image analysis. Sci Rep. 2017;7(1):16878.
    View this article via: CrossRef PubMed Google Scholar
  40. Weigert M, Schmidt U. Nuclei instance segmentation and classification in histopathology images with StarDist. Paper present at: 2022 IEEE International Symposium on Biomedical Imaging Challenges (ISBIC); March 28–31, 2022; Kolkata, India. http://uweschmidt.org/research/pubs/isbic22weigert.pdf.
  41. Yongjian Y, Acton ST. Speckle reducing anisotropic diffusion. IEEE Trans Image Process. 2002;11(11):1260–1270.
    View this article via: CrossRef PubMed Google Scholar
  42. Liu J, et al. An integrated TCGA pan-cancer clinical data resource to drive high-quality survival outcome analytics. Cell. 2018;173(2):400–416.
    View this article via: CrossRef PubMed Google Scholar
Version history
  • Version 1 (September 8, 2026): Electronic publication

Article tools

  • View PDF
  • Download citation information
  • Send a comment
  • Terms of use
  • Standard abbreviations
  • Need help? Email the journal

Metrics

  • Article usage
  • Citations to this article

Go to

  • Top
  • Abstract
  • Introduction
  • Results
  • Discussion
  • Methods
  • Author contributions
  • Conflict of interest
  • Funding support
  • Supplemental material
  • Acknowledgments
  • Footnotes
  • References
  • Version history
Advertisement
Advertisement

Copyright © 2026 American Society for Clinical Investigation
ISSN 2379-3708

Sign up for email alerts