
Research ArticleEndocrinologyMetabolism
Open Access |  10.1172/jci.insight.200202
Reduced peroxisomal function increases insulin secretion, promotes insulin oxidation, and impairs β cell maturity
J. Jason Collier,1,2 Caroline R. Cothern,1 Maggie P. Ducote,1 Thomas M. Martin,1 Melissa A. Linden,1 Robert C. Noland,1 David H. Burk,1 Samuel D. Dupuy,3 Michael D. Karlstad,3 Krisztian Stadler,1 Sarah S. Hirschbeck,4 Thanh D. Do,4 Anastasia Coldren,5 Marcela Brissova,5 Teayoun Kim,6 Kirk M. Habegger,6 Sujoy Ghosh,1 Zane A. Vickery,4 Qudus Sarumi,4 Shawn R. Campagna,4 and Susan J. Burke1,2
1Pennington Biomedical Research Center, Baton Rouge, Louisiana, USA.
2Department of Biological Sciences, Louisiana State University, Baton Rouge, Louisiana, USA.
3Department of Surgery, The University of Tennessee Graduate School of Medicine, Knoxville, Tennessee, USA.
4Department of Chemistry, The University of Tennessee Knoxville, Tennessee, USA.
5Department of Medicine, Division of Diabetes, Endocrinology, and Metabolism, Vanderbilt University Medical Center, Nashville, Tennessee, USA.
6Comprehensive Diabetes Center, The University of Alabama at Birmingham, Birmingham, Alabama, USA.
Address correspondence to: Susan J. Burke, 6400 Perkins Road, Baton Rouge, Louisiana, 70808, USA. Email: susan.burke@pbrc.edu.
Find articles by Collier, J. in: PubMed | Google Scholar
1Pennington Biomedical Research Center, Baton Rouge, Louisiana, USA.
2Department of Biological Sciences, Louisiana State University, Baton Rouge, Louisiana, USA.
3Department of Surgery, The University of Tennessee Graduate School of Medicine, Knoxville, Tennessee, USA.
4Department of Chemistry, The University of Tennessee Knoxville, Tennessee, USA.
5Department of Medicine, Division of Diabetes, Endocrinology, and Metabolism, Vanderbilt University Medical Center, Nashville, Tennessee, USA.
6Comprehensive Diabetes Center, The University of Alabama at Birmingham, Birmingham, Alabama, USA.
Address correspondence to: Susan J. Burke, 6400 Perkins Road, Baton Rouge, Louisiana, 70808, USA. Email: susan.burke@pbrc.edu.
Find articles by Cothern, C. in: PubMed | Google Scholar
1Pennington Biomedical Research Center, Baton Rouge, Louisiana, USA.
2Department of Biological Sciences, Louisiana State University, Baton Rouge, Louisiana, USA.
3Department of Surgery, The University of Tennessee Graduate School of Medicine, Knoxville, Tennessee, USA.
4Department of Chemistry, The University of Tennessee Knoxville, Tennessee, USA.
5Department of Medicine, Division of Diabetes, Endocrinology, and Metabolism, Vanderbilt University Medical Center, Nashville, Tennessee, USA.
6Comprehensive Diabetes Center, The University of Alabama at Birmingham, Birmingham, Alabama, USA.
Address correspondence to: Susan J. Burke, 6400 Perkins Road, Baton Rouge, Louisiana, 70808, USA. Email: susan.burke@pbrc.edu.
Find articles by Ducote, M. in: PubMed | Google Scholar
1Pennington Biomedical Research Center, Baton Rouge, Louisiana, USA.
2Department of Biological Sciences, Louisiana State University, Baton Rouge, Louisiana, USA.
3Department of Surgery, The University of Tennessee Graduate School of Medicine, Knoxville, Tennessee, USA.
4Department of Chemistry, The University of Tennessee Knoxville, Tennessee, USA.
5Department of Medicine, Division of Diabetes, Endocrinology, and Metabolism, Vanderbilt University Medical Center, Nashville, Tennessee, USA.
6Comprehensive Diabetes Center, The University of Alabama at Birmingham, Birmingham, Alabama, USA.
Address correspondence to: Susan J. Burke, 6400 Perkins Road, Baton Rouge, Louisiana, 70808, USA. Email: susan.burke@pbrc.edu.
Find articles by Martin, T. in: PubMed | Google Scholar
1Pennington Biomedical Research Center, Baton Rouge, Louisiana, USA.
2Department of Biological Sciences, Louisiana State University, Baton Rouge, Louisiana, USA.
3Department of Surgery, The University of Tennessee Graduate School of Medicine, Knoxville, Tennessee, USA.
4Department of Chemistry, The University of Tennessee Knoxville, Tennessee, USA.
5Department of Medicine, Division of Diabetes, Endocrinology, and Metabolism, Vanderbilt University Medical Center, Nashville, Tennessee, USA.
6Comprehensive Diabetes Center, The University of Alabama at Birmingham, Birmingham, Alabama, USA.
Address correspondence to: Susan J. Burke, 6400 Perkins Road, Baton Rouge, Louisiana, 70808, USA. Email: susan.burke@pbrc.edu.
Find articles by Linden, M. in: PubMed | Google Scholar
1Pennington Biomedical Research Center, Baton Rouge, Louisiana, USA.
2Department of Biological Sciences, Louisiana State University, Baton Rouge, Louisiana, USA.
3Department of Surgery, The University of Tennessee Graduate School of Medicine, Knoxville, Tennessee, USA.
4Department of Chemistry, The University of Tennessee Knoxville, Tennessee, USA.
5Department of Medicine, Division of Diabetes, Endocrinology, and Metabolism, Vanderbilt University Medical Center, Nashville, Tennessee, USA.
6Comprehensive Diabetes Center, The University of Alabama at Birmingham, Birmingham, Alabama, USA.
Address correspondence to: Susan J. Burke, 6400 Perkins Road, Baton Rouge, Louisiana, 70808, USA. Email: susan.burke@pbrc.edu.
Find articles by Noland, R. in: PubMed | Google Scholar
1Pennington Biomedical Research Center, Baton Rouge, Louisiana, USA.
2Department of Biological Sciences, Louisiana State University, Baton Rouge, Louisiana, USA.
3Department of Surgery, The University of Tennessee Graduate School of Medicine, Knoxville, Tennessee, USA.
4Department of Chemistry, The University of Tennessee Knoxville, Tennessee, USA.
5Department of Medicine, Division of Diabetes, Endocrinology, and Metabolism, Vanderbilt University Medical Center, Nashville, Tennessee, USA.
6Comprehensive Diabetes Center, The University of Alabama at Birmingham, Birmingham, Alabama, USA.
Address correspondence to: Susan J. Burke, 6400 Perkins Road, Baton Rouge, Louisiana, 70808, USA. Email: susan.burke@pbrc.edu.
Find articles by Burk, D. in: PubMed | Google Scholar
1Pennington Biomedical Research Center, Baton Rouge, Louisiana, USA.
2Department of Biological Sciences, Louisiana State University, Baton Rouge, Louisiana, USA.
3Department of Surgery, The University of Tennessee Graduate School of Medicine, Knoxville, Tennessee, USA.
4Department of Chemistry, The University of Tennessee Knoxville, Tennessee, USA.
5Department of Medicine, Division of Diabetes, Endocrinology, and Metabolism, Vanderbilt University Medical Center, Nashville, Tennessee, USA.
6Comprehensive Diabetes Center, The University of Alabama at Birmingham, Birmingham, Alabama, USA.
Address correspondence to: Susan J. Burke, 6400 Perkins Road, Baton Rouge, Louisiana, 70808, USA. Email: susan.burke@pbrc.edu.
Find articles by Dupuy, S. in: PubMed | Google Scholar
1Pennington Biomedical Research Center, Baton Rouge, Louisiana, USA.
2Department of Biological Sciences, Louisiana State University, Baton Rouge, Louisiana, USA.
3Department of Surgery, The University of Tennessee Graduate School of Medicine, Knoxville, Tennessee, USA.
4Department of Chemistry, The University of Tennessee Knoxville, Tennessee, USA.
5Department of Medicine, Division of Diabetes, Endocrinology, and Metabolism, Vanderbilt University Medical Center, Nashville, Tennessee, USA.
6Comprehensive Diabetes Center, The University of Alabama at Birmingham, Birmingham, Alabama, USA.
Address correspondence to: Susan J. Burke, 6400 Perkins Road, Baton Rouge, Louisiana, 70808, USA. Email: susan.burke@pbrc.edu.
Find articles by Karlstad, M. in: PubMed | Google Scholar
1Pennington Biomedical Research Center, Baton Rouge, Louisiana, USA.
2Department of Biological Sciences, Louisiana State University, Baton Rouge, Louisiana, USA.
3Department of Surgery, The University of Tennessee Graduate School of Medicine, Knoxville, Tennessee, USA.
4Department of Chemistry, The University of Tennessee Knoxville, Tennessee, USA.
5Department of Medicine, Division of Diabetes, Endocrinology, and Metabolism, Vanderbilt University Medical Center, Nashville, Tennessee, USA.
6Comprehensive Diabetes Center, The University of Alabama at Birmingham, Birmingham, Alabama, USA.
Address correspondence to: Susan J. Burke, 6400 Perkins Road, Baton Rouge, Louisiana, 70808, USA. Email: susan.burke@pbrc.edu.
Find articles by Stadler, K. in: PubMed | Google Scholar
1Pennington Biomedical Research Center, Baton Rouge, Louisiana, USA.
2Department of Biological Sciences, Louisiana State University, Baton Rouge, Louisiana, USA.
3Department of Surgery, The University of Tennessee Graduate School of Medicine, Knoxville, Tennessee, USA.
4Department of Chemistry, The University of Tennessee Knoxville, Tennessee, USA.
5Department of Medicine, Division of Diabetes, Endocrinology, and Metabolism, Vanderbilt University Medical Center, Nashville, Tennessee, USA.
6Comprehensive Diabetes Center, The University of Alabama at Birmingham, Birmingham, Alabama, USA.
Address correspondence to: Susan J. Burke, 6400 Perkins Road, Baton Rouge, Louisiana, 70808, USA. Email: susan.burke@pbrc.edu.
Find articles by Hirschbeck, S. in: PubMed | Google Scholar
1Pennington Biomedical Research Center, Baton Rouge, Louisiana, USA.
2Department of Biological Sciences, Louisiana State University, Baton Rouge, Louisiana, USA.
3Department of Surgery, The University of Tennessee Graduate School of Medicine, Knoxville, Tennessee, USA.
4Department of Chemistry, The University of Tennessee Knoxville, Tennessee, USA.
5Department of Medicine, Division of Diabetes, Endocrinology, and Metabolism, Vanderbilt University Medical Center, Nashville, Tennessee, USA.
6Comprehensive Diabetes Center, The University of Alabama at Birmingham, Birmingham, Alabama, USA.
Address correspondence to: Susan J. Burke, 6400 Perkins Road, Baton Rouge, Louisiana, 70808, USA. Email: susan.burke@pbrc.edu.
Find articles by Do, T. in: PubMed | Google Scholar
1Pennington Biomedical Research Center, Baton Rouge, Louisiana, USA.
2Department of Biological Sciences, Louisiana State University, Baton Rouge, Louisiana, USA.
3Department of Surgery, The University of Tennessee Graduate School of Medicine, Knoxville, Tennessee, USA.
4Department of Chemistry, The University of Tennessee Knoxville, Tennessee, USA.
5Department of Medicine, Division of Diabetes, Endocrinology, and Metabolism, Vanderbilt University Medical Center, Nashville, Tennessee, USA.
6Comprehensive Diabetes Center, The University of Alabama at Birmingham, Birmingham, Alabama, USA.
Address correspondence to: Susan J. Burke, 6400 Perkins Road, Baton Rouge, Louisiana, 70808, USA. Email: susan.burke@pbrc.edu.
Find articles by Coldren, A. in: PubMed | Google Scholar
1Pennington Biomedical Research Center, Baton Rouge, Louisiana, USA.
2Department of Biological Sciences, Louisiana State University, Baton Rouge, Louisiana, USA.
3Department of Surgery, The University of Tennessee Graduate School of Medicine, Knoxville, Tennessee, USA.
4Department of Chemistry, The University of Tennessee Knoxville, Tennessee, USA.
5Department of Medicine, Division of Diabetes, Endocrinology, and Metabolism, Vanderbilt University Medical Center, Nashville, Tennessee, USA.
6Comprehensive Diabetes Center, The University of Alabama at Birmingham, Birmingham, Alabama, USA.
Address correspondence to: Susan J. Burke, 6400 Perkins Road, Baton Rouge, Louisiana, 70808, USA. Email: susan.burke@pbrc.edu.
Find articles by
Brissova, M.
in:
PubMed
|
Google Scholar
|

1Pennington Biomedical Research Center, Baton Rouge, Louisiana, USA.
2Department of Biological Sciences, Louisiana State University, Baton Rouge, Louisiana, USA.
3Department of Surgery, The University of Tennessee Graduate School of Medicine, Knoxville, Tennessee, USA.
4Department of Chemistry, The University of Tennessee Knoxville, Tennessee, USA.
5Department of Medicine, Division of Diabetes, Endocrinology, and Metabolism, Vanderbilt University Medical Center, Nashville, Tennessee, USA.
6Comprehensive Diabetes Center, The University of Alabama at Birmingham, Birmingham, Alabama, USA.
Address correspondence to: Susan J. Burke, 6400 Perkins Road, Baton Rouge, Louisiana, 70808, USA. Email: susan.burke@pbrc.edu.
Find articles by
Kim, T.
in:
PubMed
|
Google Scholar
|
1Pennington Biomedical Research Center, Baton Rouge, Louisiana, USA.
2Department of Biological Sciences, Louisiana State University, Baton Rouge, Louisiana, USA.
3Department of Surgery, The University of Tennessee Graduate School of Medicine, Knoxville, Tennessee, USA.
4Department of Chemistry, The University of Tennessee Knoxville, Tennessee, USA.
5Department of Medicine, Division of Diabetes, Endocrinology, and Metabolism, Vanderbilt University Medical Center, Nashville, Tennessee, USA.
6Comprehensive Diabetes Center, The University of Alabama at Birmingham, Birmingham, Alabama, USA.
Address correspondence to: Susan J. Burke, 6400 Perkins Road, Baton Rouge, Louisiana, 70808, USA. Email: susan.burke@pbrc.edu.
Find articles by
Habegger, K.
in:
PubMed
|
Google Scholar
|
1Pennington Biomedical Research Center, Baton Rouge, Louisiana, USA.
2Department of Biological Sciences, Louisiana State University, Baton Rouge, Louisiana, USA.
3Department of Surgery, The University of Tennessee Graduate School of Medicine, Knoxville, Tennessee, USA.
4Department of Chemistry, The University of Tennessee Knoxville, Tennessee, USA.
5Department of Medicine, Division of Diabetes, Endocrinology, and Metabolism, Vanderbilt University Medical Center, Nashville, Tennessee, USA.
6Comprehensive Diabetes Center, The University of Alabama at Birmingham, Birmingham, Alabama, USA.
Address correspondence to: Susan J. Burke, 6400 Perkins Road, Baton Rouge, Louisiana, 70808, USA. Email: susan.burke@pbrc.edu.
Find articles by Ghosh, S. in: PubMed | Google Scholar
1Pennington Biomedical Research Center, Baton Rouge, Louisiana, USA.
2Department of Biological Sciences, Louisiana State University, Baton Rouge, Louisiana, USA.
3Department of Surgery, The University of Tennessee Graduate School of Medicine, Knoxville, Tennessee, USA.
4Department of Chemistry, The University of Tennessee Knoxville, Tennessee, USA.
5Department of Medicine, Division of Diabetes, Endocrinology, and Metabolism, Vanderbilt University Medical Center, Nashville, Tennessee, USA.
6Comprehensive Diabetes Center, The University of Alabama at Birmingham, Birmingham, Alabama, USA.
Address correspondence to: Susan J. Burke, 6400 Perkins Road, Baton Rouge, Louisiana, 70808, USA. Email: susan.burke@pbrc.edu.
Find articles by Vickery, Z. in: PubMed | Google Scholar
1Pennington Biomedical Research Center, Baton Rouge, Louisiana, USA.
2Department of Biological Sciences, Louisiana State University, Baton Rouge, Louisiana, USA.
3Department of Surgery, The University of Tennessee Graduate School of Medicine, Knoxville, Tennessee, USA.
4Department of Chemistry, The University of Tennessee Knoxville, Tennessee, USA.
5Department of Medicine, Division of Diabetes, Endocrinology, and Metabolism, Vanderbilt University Medical Center, Nashville, Tennessee, USA.
6Comprehensive Diabetes Center, The University of Alabama at Birmingham, Birmingham, Alabama, USA.
Address correspondence to: Susan J. Burke, 6400 Perkins Road, Baton Rouge, Louisiana, 70808, USA. Email: susan.burke@pbrc.edu.
Find articles by Sarumi, Q. in: PubMed | Google Scholar
1Pennington Biomedical Research Center, Baton Rouge, Louisiana, USA.
2Department of Biological Sciences, Louisiana State University, Baton Rouge, Louisiana, USA.
3Department of Surgery, The University of Tennessee Graduate School of Medicine, Knoxville, Tennessee, USA.
4Department of Chemistry, The University of Tennessee Knoxville, Tennessee, USA.
5Department of Medicine, Division of Diabetes, Endocrinology, and Metabolism, Vanderbilt University Medical Center, Nashville, Tennessee, USA.
6Comprehensive Diabetes Center, The University of Alabama at Birmingham, Birmingham, Alabama, USA.
Address correspondence to: Susan J. Burke, 6400 Perkins Road, Baton Rouge, Louisiana, 70808, USA. Email: susan.burke@pbrc.edu.
Find articles by Campagna, S. in: PubMed | Google Scholar
1Pennington Biomedical Research Center, Baton Rouge, Louisiana, USA.
2Department of Biological Sciences, Louisiana State University, Baton Rouge, Louisiana, USA.
3Department of Surgery, The University of Tennessee Graduate School of Medicine, Knoxville, Tennessee, USA.
4Department of Chemistry, The University of Tennessee Knoxville, Tennessee, USA.
5Department of Medicine, Division of Diabetes, Endocrinology, and Metabolism, Vanderbilt University Medical Center, Nashville, Tennessee, USA.
6Comprehensive Diabetes Center, The University of Alabama at Birmingham, Birmingham, Alabama, USA.
Address correspondence to: Susan J. Burke, 6400 Perkins Road, Baton Rouge, Louisiana, 70808, USA. Email: susan.burke@pbrc.edu.
Find articles by Burke, S. in: PubMed | Google Scholar
Published June 30, 2026 - More info
JCI Insight. 2026;11(15):e200202. https://doi.org/10.1172/jci.insight.200202.
© 2026 Collier et al. This work is licensed under the Creative Commons Attribution 4.0 International License. To view a copy of this license, visit http://creativecommons.org/licenses/by/4.0/.
Received: January 29, 2026; Accepted: June 16, 2026

-
Results
Pancreas- and β cell–specific deletion of Pex5 impairs peroxisomal matrix protein import and peroxisome function. Peroxisomes are abundant in β cells (4,5), but their role in β cell function and maturity is unclear. Because Pex5 is required for importing the majority of peroxisomal proteins into the peroxisomal matrix, its deletion disrupts peroxisomal function (13). Therefore, using both the Pdx1-Cre and Ins1-Cre driver lines, we generated mice with a pancreas-specific (Figure 1, A–C) or β cell–specific deficiency (Figure 1, I–K) in Pex5 expression and abundance. The control group (Pex5CON) comprised littermates with the following genotypes: (a) non-floxed, non-Cre–expressing mice; (b) Pex5 floxed, non-Cre–expressing mice; and (c) Cre-expressing, non-floxed mice. These groups were combined in our analyses to increase rigor because no differences were observed among control genotypes for any parameter examined (glucose tolerance test shown in Supplemental Figure 1, A and B, as an example; supplemental material available online with this article; https://doi.org/10.1172/jci.insight.200202DS1).
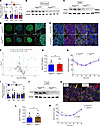 Figure 1
Pancreas- and β cell–specific deletion of Pex5 impairs peroxisomal matrix protein import and function. (A) Pex5 mRNA abundance by RT-PCR from Pex5CON and Pex5Pdx1–/– mice; n = 7–14. (B) Pex5 abundance by immunoblot in pancreatic lysates and (C) isolated islets; n = 3–4. (D) Pancreatic tissue from Pex5CON (top panels) and Pex5Pdx1–/– (bottom panels) mice costained for PMP70 (cyan), insulin (green), and Hoechst (gray); n = 3 with representative image shown. Scale bars:100 μm (columns 1–3) and 20 μm (last column is a higher-resolution image of tissue denoted by yellow box in 3rd column). (E) Pancreatic tissue costained for Acox1 (green), PMP70 (red), insulin (blue), and Hoechst (gray); n = 3 with representative image shown, scale bar: 20 μm (columns 1–3) and 10 μm (last column is a higher-resolution image of tissue denoted by yellow box). (F) Volcano plot for ether lipids in pancreatic tissue from 30-week-old mice represented as Pex5Pdx1–/–/Pex5CON; n = 9–11. (G) Serum triglyceride content in 15-week-old mice; n = 8–10. (H) ITT in 10–16-week-old mice; n = 8. (I) Pex5 mRNA abundance by RT-PCR from Pex5CON and Pex5Ins1–/– mice; n = 6–8. (J) Pex5 abundance by immunoblot in isolated islets; n = 3. (K) Pancreatic tissue costained for Acox1 (green), PMP70 (red), insulin (blue), and Hoechst (gray); n = 3 with representative image shown, scale bar: 20 μm. (L) Serum triglyceride content in 15-week-old mice; n = 10–14. (M) ITT in 16–20-week-old mice; n = 20. (A–M) Male mice; ns, not significant; **P < 0.01; ****P < 0.0001. P values shown on graph represent AUC calculations. One-way ANOVA with multiple comparisons (A and I) or 2-tailed Student’s t test (G and L).
Immunostaining for the peroxisomal membrane protein PMP70 revealed that PMP70-positive peroxisomal structures were markedly more abundant in islet cells than acinar cells of Pex5CON and Pex5Pdx1–/– mice, indicating that β cells are the major cell type affected by Pdx1-Cre–mediated recombination (Figure 1D). However, the presence of PMP70-positive structures does not differentiate between import-competent, functional peroxisomes and import-deficient residual structures, referred to as peroxisome ghosts, a known feature of the Pex5 deletion model (13). In β cells from Pex5CON mice, colocalization of PMP70 with the matrix protein, Acox1, indicated the presence of import-competent, functional peroxisomes, identified by yellow puncta (Figure 1E). In contrast, Acox1 and PMP70 colocalization was markedly reduced in β cells from Pex5Pdx1–/– mice (Figure 1E), consistent with a substantial reduction in the formation of import-competent, functional peroxisomes.
Impaired peroxisomal matrix protein import and reduced biogenesis are expected to disrupt lipid metabolism pathways, leading to alterations in lipid profiles. Consistent with this, we observed a broad reduction in the concentration of multiple ether phospholipid and ether lysophospholipid species in male Pex5Pdx1–/– mice compared with controls (Figure 1F). Loss of peroxisomal function, and more specifically altered lipid profiles, did not affect serum triglyceride levels (Figure 1G) or peripheral insulin sensitivity assessed by an insulin tolerance test (ITT; Figure 1H) in male Pex5Pdx1–/– mice. Similarly, in male Pex5Ins1–/– mice (Figure 1, I–M), the yellow arrow indicates PMP70/Acox1 colocalization in Pex5CON mice and the red arrow indicates a β cell in Pex5Ins1–/– mice with vastly reduced colocalization (Figure 1K), but serum triglyceride levels (Figure 1L) and insulin sensitivity (Figure 1M) were comparable between genotypes.
Body mass and composition were assessed in male mice from 8 to 30 weeks and female mice from 12 to 36 weeks. Male Pex5Pdx1–/– mice exhibited increased body mass (Supplemental Figure 2A), fat mass (Supplemental Figure 2B), and fluid mass (Supplemental Figure 2C) by 10 weeks of age, with no change in lean mass (Supplemental Figure 2D). In a separate cohort of male mice, we evaluated whether the increased adiposity seen in Pex5Pdx1–/– mice could be linked to changes in energy expenditure, respiratory quotient, caloric intake, or activity levels (Supplemental Figure 2, E and F). These measurements took place at 22 weeks of age when differences in body mass and fat mass were already established. Increased energy expenditure in Pex5Pdx1–/– mice was most likely due to the increase in body mass, as there were no discernible differences in food or liquid intake (Supplemental Figure 2, G and H), mean respiratory quotient (Supplemental Figure 2, I and J), total activity (Supplemental Figure 2K), or mean sleep time (Supplemental Figure 2L) between Pex5CON and Pex5Pdx1–/– mice.
Similarly, female Pex5Pdx1–/– mice exhibited increased adiposity compared with Pex5CON (Supplemental Figure 3, A–D). In contrast, no differences in body composition were observed across the lifespan of Pex5Ins1–/– male (Supplemental Figure 2, A–D) or female (Supplemental Figure 3, A–D) mice compared with Pex5CON. Similar to male mice, female Pex5Pdx1–/– and Pex5Ins1–/– mice showed no alteration in peripheral insulin sensitivity (Supplemental Figure 3E) or serum triglyceride concentration (Supplemental Figure 3F).
Peroxisomes are critical for maintenance of glucose tolerance and β cell function in male mice. Pex5 heterozygous KO mice (Pex5Pdx1+/–) displayed normal glucose tolerance compared with controls (Supplemental Figure 1, B and C). Although postprandial blood glucose was unchanged (Figure 2A), male Pex5Pdx1–/– mice exhibited impaired glucose tolerance compared with Pex5CON mice (Figure 2, B–F). Glucose tolerance tests (GTTs) i.p. administered to male Pex5Pdx1–/– mice at 8, 12, 20, and 30 weeks of age (Figure 2, B–E), demonstrated that glucose intolerance manifests early in life, even prior to alterations in body composition (Supplemental Figure 2, A–D). The phenotype was also consistent in male Pex5Pdx1–/– mice during an oral GTT (Figure 2F).
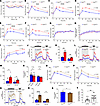 Figure 2
Peroxisomes are critical for maintenance of glucose tolerance and β cell function in male mice. (A) Fed blood glucose values in male Pex5CON, Pex5Pdx1–/–, and Pex5Ins1–/– mice from 8 to 30 weeks of age; n = 26–34. (B–E) i.p. GTTs in 8- (n = 9–14), 12- (n = 22), 20- (n = 15–16), and 30- (n = 8–19) week-old mice. (F) Oral GTT in 15-week-old mice; n = 11–25. (G–I) Fasting blood glucose, glucose infusion rate, and plasma insulin during a hyperglycemic clamp in 18-week-old mice; n = 4. (J–M) Glucose-mediated (16.7 mM glucose; G 16.7) and KCl-mediated (20 mM; KCl 20) insulin secretion and corresponding AUC calculations in isolated islets from 12- and 30-week-old mice, respectively; n = 6. (N) Insulin content in islets used for experiments in J–M; n = 6–13. (O) i.p. GTT in 30-week-old male Pex5CON and Pex5Ins1–/– mice; n = 29–31. (P) Oral GTT in 42-week-old mice; n = 9. (Q and R) Glucose-mediated (16.7 mM glucose; G 16.7) and KCl-mediated (20 mM; KCl 20) insulin secretion and corresponding AUC calculation in isolated islets from 30-week-old mice; n = 4. (S) Insulin content in islets used for the experiment in Q and R. (T) GSIS (2 mM versus 20 mM glucose) in 832/13 cells treated for 48 hours with siRNA control (siCTRL) or siRNA duplexes targeting the Pex5 gene (siPex5) prior to glucose treatment; n = 3 individual experiments with 4 replicates for each experiment. ns, not significant; *P < 0.05; **P < 0.01; ****P < 0.0001. P values shown on graph represent AUC versus controls. One-way ANOVA with multiple comparisons (K, M, N, and R) or 2-tailed Student’s t test (S and T); wo, weeks old.
We next examined GSIS both in vivo by hyperglycemic clamp and ex vivo by perifusion using isolated islets. During the clamp, blood glucose was maintained at approximately 250 mg/dL for 120 minutes and did not differ between the genotypes (Figure 2G). No difference was observed in the glucose infusion rate (Figure 2H). Surprisingly, plasma insulin levels were significantly higher in Pex5Pdx1–/– mice compared with controls in response to hyperglycemia (Figure 2I), indicating greater insulin output in vivo. Significant increases in both glucose- and KCl-stimulated insulin secretion were observed in 12-week-old (Figure 2, J and K) and 30-week-old (Figure 2, L and M) male Pex5Pdx1–/– mice compared with controls. Despite elevations in insulin secretion, insulin content remained unchanged (Figure 2N). Glucose intolerance by GTT administered i.p. (Figure 2O) and oral GTT (Figure 2P) was also observed in male Pex5Ins1–/– mice, with a similar increase as Pex5Pdx1–/– mice in both glucose-stimulated and KCl-mediated insulin secretion compared with controls (Figure 2, Q–S). Consistent with the ex vivo data from mouse islets (2.5-, 2.8-, and 3-fold in Figure 2, K, M, and R, respectively), GSIS was elevated by 1.9-fold in Pex5-deficient 832/13 insulinoma cells (Figure 2T). Collectively, these data demonstrate that impaired peroxisome function increases β cell insulin secretion but leads to impaired glucose tolerance.
Reduced peroxisomal function in the β cells of female mice has no impact on β cell function. Postprandial blood glucose values were comparable across all female groups until 30 weeks of age, at which point Pex5Pdx1–/– mice exhibited a modest but significant increase compared with controls (Figure 3A). Both Pex5Pdx1–/– and Pex5Ins1–/– females remained glucose-tolerant early in life, as evidenced from GTTs i.p. administered at 12 and 20 weeks of age (Figure 3, B and C); however, Pex5Pdx1–/– mice displayed an age-dependent decline in glucose tolerance compared with controls by 34 weeks of age (Figure 3D). This phenotype was confirmed in Pex5Pdx1–/– females by oral GTT (Figure 3E). Overall, no loss in β cell function or insulin content was seen in female Pex5Pdx1–/– mice compared with controls (Figure 3, F–H), although females appeared to have a heterogenous phenotype in that elevations were observed in glucose- and KCl-dependent insulin secretion in 25% of the animals assessed (Figure 3, F and G).
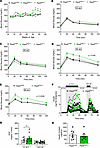 Figure 3
Reduced peroxisomal function in the β cells of female mice has no impact on β cell function. (A) Fed blood glucose values in female Pex5CON, Pex5Pdx1–/–, and Pex5Ins1–/– mice from 12 to 36 weeks of age; n = 12–23. (B–D) Intraperitoneal GTTs in 12-week-old (n = 10–20), 20-week-old (n = 10–20), and 34-week-old (n = 10–20) mice, respectively. (E) Oral GTT in 36-week-old mice; n = 8–11. (F and G) Glucose- (16.7 mM glucose; G 16.7) and KCl- (20 mM; KCl 20) mediated insulin secretion, and corresponding AUC calculation, in isolated islets from 36-week-old mice; n = 8. (H) Insulin content in islets used for experiment in F and G. ns, not significant; *P < 0.05. P values shown on graph represent AUC for Pex5CON versus Pex5Pdx1–/– groups. Multiple unpaired t tests (A), 1-way ANOVA with multiple comparisons (G), or 2-tailed Student’s t test (H); wo, weeks old.
Reduced peroxisomal function in the pancreas of male mice has no impact on islet architecture or hormone content. Enhanced GSIS in male mice that lack functional peroxisomes is not accounted for by changes in islet architecture or abundance of the islet hormones insulin and glucagon (Figure 4A). Furthermore, no changes were detected in pancreatic mass (Figure 4B) or β cell mass (Figure 4C) in Pex5Pdx1–/– or Pex5Ins1–/– mice compared with controls. These findings were confirmed with quantification of the insulin-positive area in the islet (Figure 4D) and islet fraction of the pancreas (Figure 4E). These data are consistent with islet insulin content being similar between genotypes (Figure 2, N and S). Additionally, no difference in circulating levels of insulin (Figure 4F) or glucagon (Figure 4G) were observed between genotypes.
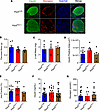 Figure 4
Reduced peroxisomal function in the pancreas of male mice has no impact on islet architecture or hormone content. (A) Pancreatic tissue from 30-week-old male Pex5CON and Pex5Pdx1–/– mice costained for insulin (green), glucagon (red), and Hoechst (blue), n = 5 with representative image shown, scale bar: 100 μm. (B and C) Pancreas mass (n = 5–10) and β cell mass (n = 5), respectively, in 30-week-old mice. (D and E) Insulin-positive area and islet fraction, respectively, in 30 week-old mice; n = 6–14. (F) Fasting serum insulin in 30-week-old mice; n = 15. (G) Fasting serum glucagon in 30-week-old mice; n = 7–22. One-way ANOVA (B–G).
Increased oxidative phosphorylation pathway activity, palmitate oxidation, and ATP content in male mice with loss of peroxisomal function. To identify differentially expressed genes (DEGs) that potentially contribute to altered β cell function in response to loss of peroxisomal function, mRNA abundance was analyzed by bulk RNA-Seq in isolated islets from male mice. We identified 3,270 DEGs between the genotypes (Figure 5A) with an enrichment in pathways involved in ribosome function, oxidative phosphorylation, lysosome function, and glycerolipid metabolism in the islets from Pex5Pdx1–/– mice (Figure 5B). Several pathways involved in various aspects of inflammation, such as T cell receptor signaling, JAK/STAT, chemokine signaling, and cytokine–cytokine-receptor interaction pathways were downregulated in islets from Pex5Pdx1–/– mice. Also, 20 genes involved in oxidative phosphorylation were upregulated in islets from Pex5Pdx1–/– mice compared with controls (Figure 5C). However, the ratio of mitochondrial DNA to nuclear DNA was unchanged (Figure 5D), suggesting total mitochondrial number was similar between the genotypes. To determine whether the observed increase in GSIS in Pex5Pdx1–/– mice may be due to a compensatory increase in long-chain fatty acid entry into mitochondria and subsequent oxidation, we assessed both pancreatic CPT1 activity and palmitate oxidation (Figure 5, E–G). Although CPT1 activity was similar between the genotypes (Figure 5E), complete oxidation of palmitate to CO2 was significantly increased in pancreatic mitochondria of Pex5Pdx1–/– mice compared with controls (Figure 5F). This response was partially attenuated by both incubation with the CPT1 inhibitor etomoxir and addition of pyruvate (Figure 5F), suggesting that although CPT1 activity is not enhanced, it is required for the increase in palmitate oxidation in Pex5Pdx1–/– mice. Incomplete oxidation of palmitate to acid soluble metabolites was similar between genotypes (Figure 5G). Oxidation of additional substrates including pyruvate (Figure 5H) and leucine (Figure 5I) were also unchanged between genotypes. Given that complete β-oxidation of palmitate generates substantial ATP through provision of acetyl-CoA to the TCA cycle and subsequent fueling of the electron transport chain and oxidative phosphorylation, we next quantified ATP levels. ATP content was significantly increased in islets from Pex5Pdx1–/– mice incubated in media containing 11 mM and 20 mM glucose but not 2 mM glucose (Figure 5J). These data support findings of increased insulin secretion in response to glucose in male Pex5Pdx1–/– mice (Figure 2). Similarly, ATP levels increased by 3.8-fold in Pex5-deficient 832/13 cells (Figure 5K). We interpret this data to indicate increased reliance on mitochondrial fatty acid oxidation, which produces more ATP per mol than glucose oxidation, in the peroxisome-compromised state.
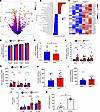 Figure 5
Loss of peroxisomal function correlates with increased oxidative phosphorylation pathway activity, palmitate oxidation, and ATP content in male mice. (A–C) Volcano plot, KEGG pathway analysis, and upregulated genes in the oxidative phosphorylation pathway, respectively, determined from RNA-Seq data in islets from 22-week-old male Pex5CON and Pex5Pdx1–/– mice; n = 3–4. (D) Mitochondrial versus nuclear DNA content in isolated islets from 22-week-old mice; n = 7–10. (E) CPT1 activity in pancreatic mitochondrial isolates from 30-week-old mice; n = 7–8. (F and G) Palmitate oxidation to CO2, or acid-soluble metabolites (ASM), respectively, in the basal state, in the presence of etomoxir (ETX) or pyruvate (PYR) in pancreatic homogenates from 30-week-old mice; n = 12–13. (H and I) Pyruvate and leucine oxidation, respectively, in pancreatic homogenates from 30-week-old mice; n = 13–14. (J) Intracellular ATP content in isolated islets from 30-week-old mice treated with glucose (2, 11, or 20 mM); n = 4–9. (K) Intracellular ATP in 832/13 cells treated for 48 hours with siCTRL or siPex5 at 11 mM glucose; n = 4 individual experiments. ns, not significant; *P < 0.05; **P < 0.01; ***P < 0.001. One-way ANOVA with multiple comparisons (D, F, G, and J), or 2-tailed Student’s t test (E, H, I, and K).
Reduction in CPT1a abundance in peroxisomal-deficient male mice restores β cell GSIS and islet ATP content to control levels. Next, we simultaneously deleted Pex5 and Cpt1a in pancreatic tissue, thereby disrupting Cpt1a-mediated import of long-chain fatty acids into mitochondria in parallel with loss of peroxisomal function. Efficient and tissue-targeted gene deletion in Pex5/Cpt1aPdx1–/– mice was confirmed in islets by reduced Pex5 and Cpt1a mRNA levels by RT-PCR, decreased Pex5 protein by Western blot, and reduced CPT1a protein abundance by IHC (Figure 6, A–C).
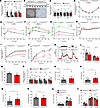 Figure 6
Reduction in CPT1a abundance in peroxisomal-deficient male mice restores β cell GSIS and islet ATP content to control levels. (A) mRNA abundance by RT-PCR in islets from male Pex5/Cpt1aCON and Pex5/Cpt1aPdx1–/– mice; n = 7–8. (B) Pex5 abundance by immunoblot in isolated islets (top) and CPT1a abundance in pancreatic tissue (bottom), n = 4, scale bar: 50 μm. (C) mRNA abundance by RT-PCR in liver and scWAT subcutaneous White Adipose Tissue (scWAT); n = 10. (D) ITT in 12-week-old mice; n = 14–18. (E) GTT (i.p.) in 14-week-old mice; n = 24–36. (F) GTT (i.p.) in 26-week-old mice; n = 8–16. (G) Serum insulin from blood taken at 0-, 15-, and 60-minute time points during GTT shown in F; n = 12–16. (H–J) Fasting blood glucose, glucose infusion rate, and plasma insulin, respectively, during hyperglycemic clamp in 18-week-old mice; n = 4–5. (K and L) Glucose-mediated (16.7 mM glucose; G 16.7) and KCl-mediated (20 mM; KCl 20) insulin secretion and corresponding AUC calculation in islets from 15-week-old mice; n = 4. (M) Insulin content in islets used for the experiment in K and L. (N) mRNA abundance by RT-PCR in islets; n = 7–8. (O–R) Insulin-positive area, islet fraction, β cell mass, and pancreas mass, respectively, in 30-week-old male mice; n = 10. (S) Serum insulin in 16-week-old (n = 7) and 30-week-old (n = 14–17) mice. (T) ATP content in isolated islets from 30-week-old mice treated with glucose (2, 11, or 20 mM); n = 4–8. ns, not significant; *P < 0.05. P values shown on graph represent AUC calculations versus controls. One-way ANOVA with multiple comparisons (A, C, L, N, S, and T) or 2-tailed Student’s t test (M and O–R).
Insulin sensitivity was comparable in both males (Figure 6D) and females (not shown) between genotypes. Glucose tolerance at 14 and 26 weeks of age revealed significantly impaired glucose clearance in Pex5/Cpt1aPdx1–/– mice compared with controls (Figure 6, E and F). To evaluate β cell function, GSIS was analyzed 3 ways: (a) in vivo during a GTT (Figure 6G), (b) by hyperglycemic clamp (Figure 6, H–J), and (c) in isolated islets using perifusion (Figure 6, K and L). As previously shown, GSIS was elevated in Pex5Pdx1–/– mice compared with controls (Figure 6G); however, GSIS in Pex5/Cpt1aPdx1–/– mice decreased in vivo compared with controls (Figure 6, G and J), with no difference between genotypes seen in isolated islets (Figure 6, K and L). During the hyperglycemic clamp, blood glucose levels were clamped at approximately 250 mg/dL for 120 minutes and were not significantly different between the genotypes (Figure 6H). The observed decrease in GSIS during a hyperglycemic clamp corresponds with a reduction in the glucose infusion rate in Pex5/Cpt1aPdx1–/– mice (Figure 6I). There were no differences in insulin content (Figure 6M), β cell transcription factor expression (Figure 6N), insulin-positive area (Figure 6O), islet fraction (Figure 6P), β cell mass (Figure 6Q), pancreas mass (Figure 6R), or circulating insulin levels (Figure 6S) across genotypes. Furthermore, unlike Pex5Pdx1–/– mice (Figure 5), Pex5/Cpt1aPdx1–/– mice did not exhibit increased ATP levels at stimulatory glucose concentrations (Figure 6T). These findings highlight the indispensable role of mitochondrial fatty acid import and subsequent oxidation to provide ATP for enhanced GSIS under conditions of peroxisomal dysfunction in β cells.
Loss of functional peroxisomes correlates with increased abundance of posttranslationally modified insulin 1 and 2 and a truncated insulin 2 peptide. Despite increased GSIS in Pex5Pdx1–/– mice, there was glucose intolerance with no change in peripheral insulin sensitivity. To uncover the mechanism underlying this contradictory phenotype, we performed liquid chromatography–ion mobility spectrometry–mass spectrometry (LC-IMS-MS) on islets from Pex5CON and Pex5Pdx1–/– mice. This technique is used to identify and quantify peptides with posttranslational modifications and can also identify fragmented peptides. Retention time of insulin 1 (green box) and 2 (orange box) by LC chromatogram (Figure 7A) and the entire mass spectrum revealing all insulin 1 and 2 peaks at different charge states and the arrival time distribution of peaks at 966.4 m/z and 1,159.5 m/z (Figure 7B) were determined. The relative ion abundances of both insulin 1 and insulin 2 showed upward trends in Pex5Pdx1–/– mice compared with controls, though these increases were not statistically significant (Figure 7B). The ion abundance of oxidized insulin 1 (Figure 7, C and F) and insulin 2 (Figure 7, D and H) was markedly increased in islets from Pex5Pdx1–/– mice compared with controls. Specifically, the proportion of insulin 1 detected in an oxidized state increased by 102%, rising from 4.6% in Pex5CON mice to 9.3% in Pex5Pdx1–/– mice (Figure 7G). Similarly, oxidized insulin 2 increased by 54%, from 8.5% in controls to 13.1% in islets from Pex5Pdx1–/– mice (Figure 7I). Furthermore, a truncated insulin 2–derived peptide, detection of which was almost negligible in islets from Pex5CON mice, reached nearly 2% of total insulin 2 in islets from Pex5Pdx1–/– mice (Figure 7, E, J, and K). Combined with findings of elevated GSIS and concomitant reductions in glucose tolerance, these data suggest that oxidative modifications to the insulin protein may limit its function in circulation.
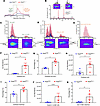 Figure 7
Loss of functional peroxisomes correlates with increased abundance of posttranslationally modified insulin 1 and 2 and a truncated insulin 2 peptide in male Pex5Pdx1–/– mice. (A) Liquid chromatography (LC) chromatogram of insulin 1 eluting at 15.4–16 minutes and insulin 2 eluting at 16–17 minutes. (B) Entire mass spectrum revealing all insulin 1 and 2 peaks at different charge states and the arrival time distribution of peaks at 966.4 m/z and 1,159.5 m/z. (C–E) Mass spectra and arrival time distributions of insulin 1 and oxidized insulin 1; insulin 2 and oxidized insulin 2; and insulin 2: A+B(1–25) fragment, respectively. (F) Ion abundance of oxidized insulin 1, (G) percentage ion abundance of oxidized insulin 1/insulin 1, (H) ion abundance of oxidized insulin 2, (I) percentage ion abundance of oxidized insulin 2/insulin 2, (J) ion abundance of insulin 2: A+B(1–25) fragment, and (K) percentage ion abundance of insulin 2: A+B(1–25) fragment/insulin 2, in islets from 30-week-old Pex5CON and Pex5Pdx1–/– mice. n = 4 individual islets per genotype. *P < 0.05. 2-tailed Student’s t test (F–K).
Coordinated alterations in oxidative stress signature in pancreas and islets from Pex5Pdx1–/– mice. Metabolomics analyses were performed on pancreas from 12-week-old and 30-week-old males, as well as 36-week-old females, corresponding to ages when GTTs and GSIS assays were performed (Figure 2), to identify metabolites associated with changes in insulin oxidation and secretion. We detected189 metabolites (Figure 8, A–C, and Supplemental Figure 4); the majority of significantly altered compounds were observed in 12-week-old males (27 metabolites; 12 upregulated and 15 downregulated in Pex5Pdx1–/– mice) and 30-week-old males (34 downregulated metabolites in Pex5Pdx1–/– mice), and only 2 upregulated metabolites were detected in female Pex5Pdx1–/– mice. Most notable were increased abundance of glutathione (Figure 8A), a major intracellular antioxidant (14); 8-hydroxy-2′-deoxyguanosine (Figure 8, A and D), an oxidative DNA modification (15); and 4-hydroxynonenal (Figure 8, A and E), a downstream byproduct of lipid peroxidation (16), in 12-week-old Pex5Pdx1–/– mice. Interestingly, most of these metabolites were either downregulated or unchanged between genotypes in older Pex5Pdx1–/– mice (Figure 8B and Supplemental Figure 4). These findings suggest an early increase in oxidative stress in β cells of Pex5Pdx1–/– male mice correlating with alterations in β cell function and glucose homeostasis (Figure 2).
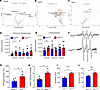 Figure 8
Coordinated alterations in oxidative stress signature in pancreas and islets from Pex5Pdx1–/– mice. (A–C) Volcano plots for identified metabolites including (D) 8-hydroxy-2′-deoxyguanosine, and (E) 4-hydroxynonenal in pancreatic tissue from 12-week-old male (A), 30-week-old male (B), and 36-week-old female (C) Pex5CON and Pex5Pdx1–/– mice; n = 9–11. (F) Representative EPR spectra of carbon-centered lipid-derived radical adducts (POBN-LOO•) in pancreatic tissue from 20-week-old male mice and (G) bar graphs show EPR signal intensities (arbitrary units) of the measured peak amplitudes normalized to 300 mg tissue. (H) Protein carbonylation in islets from 28-week-old male mice. (I and J) Gene expression, expressed as normalized counts, for the (I) Sod1 and (J) Gpx1 genes in islets from 22-week-old male mice. (F–J) n = 4–6 per genotype. *P < 0.05, **P < 0.01. One-way ANOVA with multiple comparisons (D and E), or 2-tailed Student’s t test (G–J); wo, weeks old.
To directly investigate markers of oxidative stress, we measured lipid peroxidation using electron paramagnetic resonance (EPR) spectroscopy. The 6-line spectrum in Figure 8F is consistent with POBN-LOO•, a lipid peroxyl radical trapped by the chemical compound POBN (identified through hyperfine coupling constants aN = 15.75 ± 0.06 G and aβH = 2.77 ± 0.07 G) (17). EPR signal intensities of the measured peak amplitudes confirmed an 80.8% increase in lipid peroxidation in Pex5Pdx1–/– mice (Figure 8G). Further, we observed an 81.3% increase in protein carbonylation, an irreversible protein modification indicative of oxidative damage (18), in islets from male Pex5Pdx1–/– mice compared with controls (Figure 8H). RNA-Seq analysis revealed several key genes that participate in cellular antioxidant defenses were upregulated in islets from Pex5Pdx1–/– mice, including Sod1 (Figure 8I) and Gpx1 (Figure 8J). These data support a model of increased oxidative stress in the absence of functional peroxisomes driving oxidative modifications of DNA, lipids, and proteins including insulin in the β cell.
Global shifts in transcriptional signature in islets from Pex5Pdx1–/– mice. RNA-Seq analysis uncovered that peroxisomal insufficiency in the pancreas produced a gene signature associated with β cell immaturity or transdifferentiation. Specifically, gene expression patterns in islets indicated a shift toward an exocrine pancreas-like (acinar cell) phenotype. In addition to a decrease in markers of β cell maturity (e.g., Mafa, Mafb), Npy, a marker of immature β cells, was upregulated in islets of Pex5Pdx1–/– mice (Figure 9A). Furthermore, expression of genes more commonly expressed in exocrine pancreatic tissue were upregulated in islets from Pex5Pdx1–/– mice including proteases (e.g., Cela1, Cpa1, Prss2, Spink1, and Try4), lipases (e.g., Cel, Clps, Pnlip, Pnliprp1, and Pnliprp2), and genes encoding regulatory factors (e.g., Reg1, Reg3a, and Rnase1) (Figure 9A).
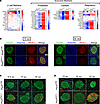 Figure 9
Global shifts in transcriptional signature in islets from male Pex5Pdx1–/– mice. (A) Change in expression of β cell and exocrine markers determined from RNA-Seq data in islets from 22-week-old Pex5CON and Pex5Pdx1–/– mice; n = 3–4. (B) Pancreatic tissue from 15-week-old (left panel) and 30-week-old (right panel) mice costained for insulin (green), Nkx6.1 (red), and Hoechst (blue). (C) Pancreatic tissue from 6–8-week-old, 15-week-old, and 30-week-old mice costained for insulin (green), ALDH1A3 (red), and Hoechst (blue). (D) Pancreatic tissue from 15-week-old, 30-week-old, and 52-week-old mice costained for insulin (green), ALDH1A3 (red), and Hoechst (blue). (B–D) n = 5 with representative image shown, scale bars: 100 μm; wo, weeks old.
To confirm that loss of β cell maturity markers and dedifferentiation occur in response to decreased peroxisomal function, we stained pancreatic tissue for Nkx6.1 and ALDH1A3. Nkx6.1 is a transcription factor that regulates insulin gene expression, and decreased nuclear staining of Nkx6.1 is associated with a decrease in β cell maturity (19). Decreased nuclear abundance of Nkx6.1 was observed at 15 and 30 weeks of age in Pex5Pdx1–/– mice compared with controls (Figure 9B). ALDH1A3 is a marker of β cell dedifferentiation in human (20, 21) and mouse models of type 2 diabetes (22, 23) and is also upregulated in other models of β cell dysfunction (7, 24–26). We noted increased colocalization of ALDH1A3 with insulin in islets at 6 weeks of age in Pex5Pdx1–/– mice that progressively worsened with age (Figure 9C). A similar phenotype was seen in Pex5Ins1–/– mice on a more delayed timeframe, with widespread detection of ALDH1A3 in islets at 52 weeks (Figure 9D).
Loss of functional peroxisomes in pancreatic tissue promotes β cell dedifferentiation in female mice. RNA-Seq analysis from female islets showed only 18 DEGs (Figure 10A), indicating a sexually dimorphic transcriptional signature in Pex5Pdx1–/– mice consistent with the milder metabolic phenotype compared with male mice (Figure 3). Two genes were confirmed by RT-PCR to be upregulated in islets from female Pex5Pdx1–/– mice: Npy, also increased in male mice, and Nptx2 (Figure 10B). Neuropeptide Y (Npy) is expressed in progenitor cell populations during pancreatic development and epigenetically downregulated in mature β cells (27). In addition, NPY expression increases in β cells in humans and mice with type 2 diabetes and correlates with reduced β cell function (27, 28). Furthermore, ALDH1A3 was notably expressed in β cells of Pex5Pdx1–/– mice (Figure 10C).
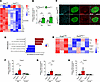 Figure 10
Loss of functional peroxisomes in pancreatic tissue promotes β cell dedifferentiation in female mice. (A) RNA-Seq data in islets from 36-week-old female Pex5CON and Pex5Pdx1–/– mice; n = 4. (B) Npy and Nptx2 mRNA abundance by RT-PCR in islets; n = 7. (C) Pancreatic tissue from 36-week-old mice costained for insulin (green), ALDH1A3 (red), and Hoechst (blue), n = 5 with representative image shown, scale bar: 100 μm. (D and E) KEGG pathway analysis and expression of genes in the glycerolipid metabolism pathway, respectively, determined from RNA-Seq data in islets from 36-week-old mice; n = 4. (F–H) Pnliprp1, Reg1, and Reg3a mRNA abundance, respectively, by RT-PCR in islets from male (n = 9) and female (n = 7) mice. *P < 0.05, ***P < 0.001, ****P < 0.0001. One-way ANOVA with multiple comparisons (B and F–H).
However, unlike islets from male Pex5Pdx1–/– mice that displayed increased expression of genes involved in glycerolipid and oxidative phosphorylation metabolism (Figure 5, B and C), KEGG analysis in islets from female Pex5Pdx1–/– mice showed an overall decrease in the glycerolipid metabolism pathway (Figure 10, D and E), with no evidence of altered expression of genes regulating oxidative phosphorylation (Figure 10D). Similarly, acinar-enriched genes that were upregulated in islets from male Pex5Pdx1–/– mice were either reduced in females (Spink1, Clps, Cpa1, Cela3b, Prss2, and Reg3g; Figure 10A) or showed no change (Pnliprp1, Reg1, and Reg3a; Figure 10, F–H). Overall, the RNA-Seq datasets were consistent with the premise that peroxisomal insufficiency in the pancreas drives β cell immaturity and dedifferentiation, although the phenotype was more severe in male mice. Another key finding revealed here is that male mice had a robust transcriptomic shift toward an acinar-like phenotype and metabolic reprogramming, whereas females displayed a more limited loss of β cell identity markers.


