
Research ArticleCell biologyMetabolismPulmonology
Open Access |  10.1172/jci.insight.199449
TGF-β coordinates alanine synthesis and import for myofibroblast differentiation in pulmonary fibrosis
Fei Li,1 Niv Vigder,2,3,4 David R. Ziehr,5 Mari Kamiya,2 Hung N. Nguyen,2 Diana E. Ferreyra Faustino,1 Aseel H. Khalil,1 Hilaire C. Lam,1 Matthew L. Steinhauser,6,7 Edy Y. Kim,2 and William M. Oldham1
1Department of Medicine, The Warren Alpert Medical School of Brown University, Providence, Rhode Island, USA.
2Department of Medicine, Brigham and Women’s Hospital and Harvard Medical School, Boston, Massachusetts, USA.
3School of Life and Environmental Sciences, Faculty of Science, The University of Sydney, Sydney, New South Wales, Australia.
4Metabolomics Platform, The Broad Institute of MIT and Harvard, Cambridge, Massachusetts, USA.
5Department of Medicine, Massachusetts General Hospital and Harvard Medical School, Boston, Massachusetts, USA.
6Department of Medicine, University of Pittsburgh Medical Center, Pittsburgh, Pennsylvania, USA.
7Aging Institute, University of Pittsburgh School of Medicine, Pittsburgh, Pennsylvania, USA.
Find articles by Li, F. in: PubMed | Google Scholar
1Department of Medicine, The Warren Alpert Medical School of Brown University, Providence, Rhode Island, USA.
2Department of Medicine, Brigham and Women’s Hospital and Harvard Medical School, Boston, Massachusetts, USA.
3School of Life and Environmental Sciences, Faculty of Science, The University of Sydney, Sydney, New South Wales, Australia.
4Metabolomics Platform, The Broad Institute of MIT and Harvard, Cambridge, Massachusetts, USA.
5Department of Medicine, Massachusetts General Hospital and Harvard Medical School, Boston, Massachusetts, USA.
6Department of Medicine, University of Pittsburgh Medical Center, Pittsburgh, Pennsylvania, USA.
7Aging Institute, University of Pittsburgh School of Medicine, Pittsburgh, Pennsylvania, USA.
Find articles by Vigder, N. in: PubMed | Google Scholar
1Department of Medicine, The Warren Alpert Medical School of Brown University, Providence, Rhode Island, USA.
2Department of Medicine, Brigham and Women’s Hospital and Harvard Medical School, Boston, Massachusetts, USA.
3School of Life and Environmental Sciences, Faculty of Science, The University of Sydney, Sydney, New South Wales, Australia.
4Metabolomics Platform, The Broad Institute of MIT and Harvard, Cambridge, Massachusetts, USA.
5Department of Medicine, Massachusetts General Hospital and Harvard Medical School, Boston, Massachusetts, USA.
6Department of Medicine, University of Pittsburgh Medical Center, Pittsburgh, Pennsylvania, USA.
7Aging Institute, University of Pittsburgh School of Medicine, Pittsburgh, Pennsylvania, USA.
Find articles by Ziehr, D. in: PubMed | Google Scholar
1Department of Medicine, The Warren Alpert Medical School of Brown University, Providence, Rhode Island, USA.
2Department of Medicine, Brigham and Women’s Hospital and Harvard Medical School, Boston, Massachusetts, USA.
3School of Life and Environmental Sciences, Faculty of Science, The University of Sydney, Sydney, New South Wales, Australia.
4Metabolomics Platform, The Broad Institute of MIT and Harvard, Cambridge, Massachusetts, USA.
5Department of Medicine, Massachusetts General Hospital and Harvard Medical School, Boston, Massachusetts, USA.
6Department of Medicine, University of Pittsburgh Medical Center, Pittsburgh, Pennsylvania, USA.
7Aging Institute, University of Pittsburgh School of Medicine, Pittsburgh, Pennsylvania, USA.
Find articles by Kamiya, M. in: PubMed | Google Scholar
1Department of Medicine, The Warren Alpert Medical School of Brown University, Providence, Rhode Island, USA.
2Department of Medicine, Brigham and Women’s Hospital and Harvard Medical School, Boston, Massachusetts, USA.
3School of Life and Environmental Sciences, Faculty of Science, The University of Sydney, Sydney, New South Wales, Australia.
4Metabolomics Platform, The Broad Institute of MIT and Harvard, Cambridge, Massachusetts, USA.
5Department of Medicine, Massachusetts General Hospital and Harvard Medical School, Boston, Massachusetts, USA.
6Department of Medicine, University of Pittsburgh Medical Center, Pittsburgh, Pennsylvania, USA.
7Aging Institute, University of Pittsburgh School of Medicine, Pittsburgh, Pennsylvania, USA.
Find articles by Nguyen, H. in: PubMed | Google Scholar
1Department of Medicine, The Warren Alpert Medical School of Brown University, Providence, Rhode Island, USA.
2Department of Medicine, Brigham and Women’s Hospital and Harvard Medical School, Boston, Massachusetts, USA.
3School of Life and Environmental Sciences, Faculty of Science, The University of Sydney, Sydney, New South Wales, Australia.
4Metabolomics Platform, The Broad Institute of MIT and Harvard, Cambridge, Massachusetts, USA.
5Department of Medicine, Massachusetts General Hospital and Harvard Medical School, Boston, Massachusetts, USA.
6Department of Medicine, University of Pittsburgh Medical Center, Pittsburgh, Pennsylvania, USA.
7Aging Institute, University of Pittsburgh School of Medicine, Pittsburgh, Pennsylvania, USA.
Find articles by Faustino, D. in: PubMed | Google Scholar
1Department of Medicine, The Warren Alpert Medical School of Brown University, Providence, Rhode Island, USA.
2Department of Medicine, Brigham and Women’s Hospital and Harvard Medical School, Boston, Massachusetts, USA.
3School of Life and Environmental Sciences, Faculty of Science, The University of Sydney, Sydney, New South Wales, Australia.
4Metabolomics Platform, The Broad Institute of MIT and Harvard, Cambridge, Massachusetts, USA.
5Department of Medicine, Massachusetts General Hospital and Harvard Medical School, Boston, Massachusetts, USA.
6Department of Medicine, University of Pittsburgh Medical Center, Pittsburgh, Pennsylvania, USA.
7Aging Institute, University of Pittsburgh School of Medicine, Pittsburgh, Pennsylvania, USA.
Find articles by Khalil, A. in: PubMed | Google Scholar
1Department of Medicine, The Warren Alpert Medical School of Brown University, Providence, Rhode Island, USA.
2Department of Medicine, Brigham and Women’s Hospital and Harvard Medical School, Boston, Massachusetts, USA.
3School of Life and Environmental Sciences, Faculty of Science, The University of Sydney, Sydney, New South Wales, Australia.
4Metabolomics Platform, The Broad Institute of MIT and Harvard, Cambridge, Massachusetts, USA.
5Department of Medicine, Massachusetts General Hospital and Harvard Medical School, Boston, Massachusetts, USA.
6Department of Medicine, University of Pittsburgh Medical Center, Pittsburgh, Pennsylvania, USA.
7Aging Institute, University of Pittsburgh School of Medicine, Pittsburgh, Pennsylvania, USA.
Find articles by Lam, H. in: PubMed | Google Scholar
1Department of Medicine, The Warren Alpert Medical School of Brown University, Providence, Rhode Island, USA.
2Department of Medicine, Brigham and Women’s Hospital and Harvard Medical School, Boston, Massachusetts, USA.
3School of Life and Environmental Sciences, Faculty of Science, The University of Sydney, Sydney, New South Wales, Australia.
4Metabolomics Platform, The Broad Institute of MIT and Harvard, Cambridge, Massachusetts, USA.
5Department of Medicine, Massachusetts General Hospital and Harvard Medical School, Boston, Massachusetts, USA.
6Department of Medicine, University of Pittsburgh Medical Center, Pittsburgh, Pennsylvania, USA.
7Aging Institute, University of Pittsburgh School of Medicine, Pittsburgh, Pennsylvania, USA.
Find articles by
Steinhauser, M.
in:
PubMed
|
Google Scholar
|

1Department of Medicine, The Warren Alpert Medical School of Brown University, Providence, Rhode Island, USA.
2Department of Medicine, Brigham and Women’s Hospital and Harvard Medical School, Boston, Massachusetts, USA.
3School of Life and Environmental Sciences, Faculty of Science, The University of Sydney, Sydney, New South Wales, Australia.
4Metabolomics Platform, The Broad Institute of MIT and Harvard, Cambridge, Massachusetts, USA.
5Department of Medicine, Massachusetts General Hospital and Harvard Medical School, Boston, Massachusetts, USA.
6Department of Medicine, University of Pittsburgh Medical Center, Pittsburgh, Pennsylvania, USA.
7Aging Institute, University of Pittsburgh School of Medicine, Pittsburgh, Pennsylvania, USA.
Find articles by
Kim, E.
in:
PubMed
|
Google Scholar
|
1Department of Medicine, The Warren Alpert Medical School of Brown University, Providence, Rhode Island, USA.
2Department of Medicine, Brigham and Women’s Hospital and Harvard Medical School, Boston, Massachusetts, USA.
3School of Life and Environmental Sciences, Faculty of Science, The University of Sydney, Sydney, New South Wales, Australia.
4Metabolomics Platform, The Broad Institute of MIT and Harvard, Cambridge, Massachusetts, USA.
5Department of Medicine, Massachusetts General Hospital and Harvard Medical School, Boston, Massachusetts, USA.
6Department of Medicine, University of Pittsburgh Medical Center, Pittsburgh, Pennsylvania, USA.
7Aging Institute, University of Pittsburgh School of Medicine, Pittsburgh, Pennsylvania, USA.
Find articles by
Oldham, W.
in:
PubMed
|
Google Scholar
|
Published April 23, 2026 - More info
JCI Insight. 2026;11(13):e199449. https://doi.org/10.1172/jci.insight.199449.
© 2026 Li et al. This work is licensed under the Creative Commons Attribution 4.0 International License. To view a copy of this license, visit http://creativecommons.org/licenses/by/4.0/.
Received: August 26, 2025; Accepted: April 14, 2026


-
Results
TGF-β–induced myofibroblast differentiation increases intracellular alanine. To examine how medium composition affects myofibroblast differentiation, we treated primary normal human lung fibroblasts (NHLFs) with TGF-β (2 ng/mL) in 1 of 2 commonly used fibroblast culture media, DMEM or fibroblast basal medium (FBM). DMEM is a general-purpose medium containing glutamine and branched-chain amino acids (valine, leucine, and isoleucine) but lacking NEAAs (alanine, proline, glutamate, asparagine, and aspartate) (Supplemental Table 1; supplemental material available online with this article; https://doi.org/10.1172/jci.insight.199449DS1). FBM, a fibroblast-specific medium, has a more complex proprietary amino acid composition that contains NEAAs (Supplemental Figure 1, A–E). Thus, in DMEM, fibroblasts rely on endogenous synthesis of these amino acids, enabling the interrogation of synthesis-dependent metabolic programs, whereas in FBM, extracellular availability permits the assessment of uptake-permissive metabolic remodeling.
We next performed liquid chromatography–high-resolution accurate mass spectrometry (LC/MS) to profile the intracellular metabolome of NHLFs after 48 hours of TGF-β treatment (Figure 1A). Principal component analysis (PCA) of approximately 100 measured metabolites revealed a clear separation among experimental groups, with the first principal component (50% of variance) driven by medium composition and the second principal component (27% of variance) reflecting the effects of TGF-β treatment (Figure 1B).
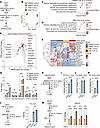 Figure 1
Increased intracellular alanine levels during myofibroblast differentiation. (A) Schematic overview of the experimental design for primary normal human lung fibroblasts (NHLFs) treated with TGF-β (2 ng/mL) in DMEM or FBM. Samples were collected and analyzed after 48 hours using LC/MS (n = 6 for each condition). (B) Principal component analysis (PCA) of the experimental groups. (C and D) Enriched metabolite sets after 48 hours of TGF-β treatment in DMEM (C) and FBM (D), based on differential metabolites with fold-change ≥ 1.5 and P ≤ 0.05. Enrichment ratio = hits / expected. (E) Comparison of intracellular amino acid changes induced by TGF-β treatment in DMEM versus FBM conditions. (F) Heatmap showing the intracellular levels of amino acids in fibroblasts cultured in DMEM or FBM with or without TGF-β stimulation for 48 hours. Each column represents a sample, and each row corresponds to an amino acid. Colors indicate z score–normalized abundance, with red and blue representing higher and lower relative levels, respectively. (G) Relative quantification of the intracellular abundances of alanine, aspartate, asparagine, proline, and glutamate. (H) Schematic overview of LC/MS-based stable isotope tracing with [U-13C6]-glucose (13C6-GLC), [U-13C5]-glutamine (13C5-GLN), or[α-15N1]-glutamine (15N1-GLN) for 48 hours. (I–K) Stable isotope label enrichment of alanine from 13C6-GLC (I), 13C5-GLN (J), or 15N1-GLN (K). (L) Schematic overview of short-term uptake assays using isotope tracing with [U-13C3]-alanine (13C3-ALA) for 1 hour (left). Signal intensity of intracellular ¹³C3-alanine (undetectable without tracer) (right). (M) Schematic overview of the experimental design for IPF human lung fibroblasts (IPF-LF) from 4 donors treated with TGF-β (2 ng/mL) in FBM for 48 hours (left). Relative quantification of intracellular alanine levels (right). For G, 1-way ANOVA; I–M, unpaired 2-tailed t test. Data are presented as mean ± SEM. ns, P > 0.05; *P < 0.05; **P < 0.01; ***P < 0.001; ****P < 0.0001.
Metabolite set enrichment analyses revealed an upregulation of amino acid metabolism after TGF-β treatment in DMEM and FBM (Figure 1, C and D). The concentrations of numerous amino acids were differentially regulated by TGF-β, regardless of culture medium. Notably, intracellular glutamine was decreased, potentially reflecting increased glutamine consumption, whereas levels of several NEAAs, including proline, alanine, and glutamate, were increased (Figure 1E). Comparison of DMEM- and FBM-cultured cells revealed baseline and TGF-β–induced differences in metabolite profiles, highlighting that medium composition can shape cellular metabolism and influence responses to profibrotic stimuli (Figure 1F). When cells were deprived of an exogenous supply of the 5 NEAAs in DMEM culture, TGF-β increased the intracellular concentrations of alanine, proline, and glutamate (Figure 1G), suggesting enhanced intracellular synthesis. Among these, the intracellular concentration of alanine, irrespective of TGF-β treatment, was significantly higher in FBM, suggesting that the intracellular level of alanine is regulated, at least in part, by the extracellular alanine pool (Figure 1G).
Given the observed increases in alanine after TGF-β treatment, we next sought to determine the metabolic origins of alanine, as determined by LC/MS-based stable isotope tracing experiments using [U-13C6]-glucose, [U-13C5]-glutamine, or [α-15N1]-glutamine (Figure 1H). [U-13C6]-glucose tracing confirmed that glucose serves as a key carbon contributor to alanine synthesis (Figure 1I), consistent with previous studies (26). TGF-β treatment further increased the fraction of glucose-labeled alanine from approximately 30% to approximately 45% (Figure 1I). We found that approximately 25% and approximately 20% of the total alanine pool was labeled from [U-13C5]-glutamine and [α-15N1]-glutamine, respectively, and that TGF-β further increased the fraction of 15N-alanine labeling from 15N1-glutamine to approximately 40% (Figure 1, H, J, and K). Taken together, these data suggest that, apart from glucose, glutamine is a critical carbon and nitrogen source for alanine synthesis under both baseline conditions and TGF-β treatment.
To quantify alanine uptake, we conducted short-term (1 hour) labeling experiments using [U-13C3]-alanine in control and TGF-β–pretreated cells in DMEM (Figure 1L). Labeled intracellular alanine was detected under both baseline and TGF-β treatment conditions, with TGF-β enhancing its accumulation (Figure 1L).
To determine whether the observed alterations in alanine metabolism are preserved in a disease context, we cultured primary fibroblasts isolated from 4 patients with IPF in FBM, which approximates the nutrient-replete in vivo environment, and confirmed that TGF-β significantly increased alanine levels intracellularly by approximately 1.5–2.5 fold (Figure 1M), consistent with previous studies reporting higher alanine levels in the lungs of patients with IPF (27, 28). These findings indicate that TGF-β–induced alanine accumulation is not restricted to normal fibroblasts under defined nutrient conditions but is conserved in primary IPF fibroblasts, supporting the relevance of this metabolic response in pulmonary fibrosis.
Glutamine promotes TGF-β–induced GPT2 expression to support myofibroblast differentiation. Alanine synthesis is mediated by GPTs. In this process, glutamine is converted to glutamate by glutaminase. Then, GPT1/2 enzymes catalyze glutamate transamination with pyruvate to generate alanine and α-KG (Figure 2A). Our [α-15N1]-glutamine tracing data demonstrated a 2.5-fold increase in transaminase activity after TGF-β treatment (Figure 1K). To specifically examine intracellular alanine synthesis in the absence of exogenous alanine, we measured cytosolic GPT1 and mitochondrial GPT2 protein expression during TGF-β–induced myofibroblast differentiation in DMEM. TGF-β increased GPT2 expression but had no effect on GPT1 (Figure 2, B and C).
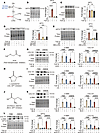 Figure 2
Glutamine promotes TGF-β–induced GPT2 expression to support myofibroblast differentiation. (A) Schematic overview of glutamine catabolism and alanine synthesis involving GPT1 and GPT2. (B and C) Western blot analysis and quantification of GPT2 (B) and GPT1 (C) in NHLFs treated with TGF-β in glutamine-deficient or glutamine-sufficient (2 mM) DMEM for 48 hours. (D and E) Western blot analysis and quantification of GPT2 in NHLFs treated with TGF-β in DMEM for 48 hours with glutaminase-1 inhibitors (CB-839, 10 μM; BPTES, 5 μM) (D) or with/without DM-α-KG (5 mM) under glutamine-deficient or -sufficient conditions (E). (F) Chemical structure of the pan-transaminase inhibitor AOA. (G) NHLFs were stimulated with TGF-β in FBM or DMEM, with or without AOA (1 mM) for 48 hours. α-SMA and COL1A1 expression were examined by Western blot. (H) Chemical structure of the GPT1/2 inhibitor CS. (I) NHLFs were stimulated with TGF-β in FBM or DMEM, with or without CS (100 μM) for 48 hours. α-SMA and COL1A1 expression were examined by Western blot. (J) Chemical structure of the GPT1/2 inhibitor BCA. (K) NHLFs were stimulated with TGF-β in FBM or DMEM, with or without BCA (100 μM) for 48 hours. α-SMA and COL1A1 expression were examined by Western blot. (L) NHLFs were transfected with control siRNA or GPT2 siRNA for 24 hours, followed by 24 hours of starvation. Cells were then stimulated with TGF-β in FBM or DMEM for 48 hours. GPT2-knockdown efficiency, α-SMA, and COL1A1 expression were examined by Western blot. Individual data points represent biological replicates. For B–E, 1-way ANOVA; G, I, K, and L, 1-way ANOVA versus TGF-β within each medium. ns, P > 0.05; *P < 0.05; **P < 0.01; ***P < 0.001; ****P < 0.0001.
To determine the role of GPT2 in myofibroblast differentiation, we first examined the effects of TGF-β in medium lacking glutamine (Gln), a primary source of glutamate for GPT2-catalyzed transamination of pyruvate to alanine. Interestingly, TGF-β did not increase GPT2 expression in the absence of glutamine (Figure 2B). Because SLC1A5 is a major glutamine transporter implicated in fibroblast activation (29), we next evaluated its role using both siRNA-mediated knockdown and pharmacological inhibition with V-9302. SLC1A5 knockdown significantly reduced GPT2 protein expression under TGF-β stimulation (Supplemental Figure 2A). Consistently, V-9302 treatment also decreased TGF-β–induced GPT2 levels (Supplemental Figure 2B), indicating that glutamine transport contributes to GPT2 regulation. Similarly, the glutaminase-1 inhibitors telaglenastat (CB-839) and BPTES suppressed TGF-β–induced upregulation of GPT2 protein expression in glutamine-containing medium (Figure 2D), despite discrepancies with previous studies (19, 30). Additionally, glutamine deficiency may decrease protein expression by impairing translation or stability, a process that can be rescued by α-KG (31). Indeed, we found that supplementation with a cell-permeable analogue of α-KG [dimethyl (DM)-α-KG] enabled the TGF-β–induced upregulation of GPT2 protein expression even in the absence of glutamine (Figure 2E). Taken together, these data suggest that a glutamine/glutamate/α-KG metabolic axis mediates TGF-β–induced upregulation of GPT2.
We next examined direct inhibition of GPT2 by small molecules to investigate its role in TGF-β–induced myofibroblast differentiation. We first used the pan-transaminase inhibitor, aminooxyacetic acid (AOA) (32), which has been shown previously to block α-SMA and collagen production during myofibroblast differentiation (13). Unexpectedly, AOA did not inhibit TGF-β–mediated upregulation of α-SMA and COL1A1 in FBM, although it was effective in DMEM as previously demonstrated (Figure 2, F and G) (13). We then tested the effects of the GPT1/2 inhibitors L-cycloserine (CS) and β-chloro-l-alanine (BCA) (33). Like AOA, both CS and BCA suppressed TGF-β–induced upregulation of α-SMA and COL1A1 protein expression in DMEM but had no effect in FBM (Figure 2, H–K, and Supplemental Figure 2, C–F). Given that CS and BCA lack selectivity for individual GPT isoforms (i.e., GPT1 vs. GPT2), we next used RNA interference to study the role of each isoform separately. GPT1 knockdown had no effect on myofibroblast differentiation in either FBM or DMEM, as assessed by the relative protein expression of COL1A1 and α-SMA (Supplemental Figure 2G). By contrast, GPT2 knockdown significantly decreased the TGF-β–induced upregulation of α-SMA and COL1A1 protein expression in DMEM (Figure 2L). Consistently, GPT2 knockdown also decreased ACTA2 (encoding α-SMA), COL1A1, FN1 (encoding fibronectin), and CTGF mRNA, further supporting suppression of the profibrotic program at a transcriptional level (Supplemental Figure 2H). Notably, GPT2 knockdown did not affect the activation of Smad3 signaling measured 1 hour after TGF-β treatment (Supplemental Figure 2I). Together, these results suggest that GPT2 is required for myofibroblast differentiation only under NEAA-deficient conditions (i.e., DMEM). In contrast, when exogenous NEAAs are available (i.e., FBM), GPT2 is redundant with respect to TGF-β–induced myofibroblast differentiation.
Alanine is essential for α-SMA expression and collagen production in myofibroblasts. Next, we investigated whether the role of GPT2 in supporting myofibroblast differentiation depends on alanine metabolism. To this end, we analyzed intracellular metabolite profiles after either genetic knockdown or pharmacological inhibition of GPT2 in DMEM-cultured fibroblasts. In the absence of TGF-β, AOA and BCA treatment markedly altered the intracellular concentration of 24 and 27 metabolites, respectively, while both CS and GPT2 knockdown separately led to differential regulation of 4 metabolites (Figure 3A). Alanine was the only metabolite that was consistently downregulated by each of the 4 treatments (Figure 3, A and B). Notably, after TGF-β stimulation, alanine remained the most prominently altered amino acid across all treatment groups (Supplemental Figure 3, A–D).
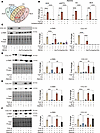 Figure 3
Alanine is essential for myofibroblast differentiation. (A) Venn diagram depicting the number of differentially regulated metabolites across 4 treatment conditions compared with their respective control groups, with alanine as the only shared metabolite. Differential metabolites: fold-change ≥ 1.5 and P ≤ 0.05. (B) Intracellular alanine levels in NHLFs treated with TGF-β for 48 hours, with or without GPT2 knockdown or inhibition in DMEM. (C) Western blot analysis and quantification of α-SMA and COL1A1 expression in NHLFs treated with AOA (1 mM) and TGF-β for 48 hours in DMEM, with or without individual NEAA supplementation (2 mM each). (D) NHLFs were stimulated with TGF-β in DMEM for 48 hours, with or without CS (100 μM) and alanine supplementation (2 mM). α-SMA and COL1A1 expression were examined by Western blot. (E) NHLFs were stimulated with TGF-β in DMEM for 48 hours, with or without BCA (100 μM) and alanine supplementation (2 mM). α-SMA and COL1A1 expression were examined by Western blot. (F) NHLFs were transfected with control siRNA or GPT2 siRNA for 24 hours, followed by 24 hours of starvation. Cells were then stimulated with TGF-β in DMEM for 48 hours, with or without alanine supplementation. α-SMA and COL1A1 expression were examined by Western blot. For Western blot, individual data points represent biological replicates. B versus TGF-β and C–F versus knockdown/inhibitor plus TGF-β were analyzed using 1-way ANOVA. Data are presented as mean ± SEM. ns, P > 0.05; *P < 0.05; **P < 0.01; ***P < 0.001; ****P < 0.0001.
To determine whether alanine deficiency impairs myofibroblast differentiation, we performed rescue experiments by supplementing 2 mM exogenous alanine, as previously reported (26, 34, 35). Since DMEM lacks 5 NEAAs, we compared alanine with the 4 other NEAAs. Alanine — but not proline, aspartate, asparagine, or glutamate — significantly reversed the inhibitory effect of AOA on TGF-β–induced α-SMA and COL1A1 protein upregulation (Figure 3C). Similarly, alanine restored TGF-β–induced upregulation of α-SMA and COL1A1 that was suppressed by CS (Figure 3D), BCA (Figure 3E), or GPT2 knockdown (Figure 3F). These data demonstrate that alanine is required for myofibroblast differentiation and can bypass the antifibrotic effects of GPT2 inhibition.
SLC38A2 facilitates alanine uptake to support myofibroblast differentiation. Given that inhibition of intracellular alanine synthesis did not impair myofibroblast differentiation in alanine-replete FBM, we hypothesized that cells may regulate the intracellular alanine pool by increasing uptake of alanine from the medium. Alanine uptake is mediated by the SLC family of transporters, with previous studies implicating ASCT1 (SLC1A4), ASCT2 (SLC1A5), SNAT1 (SLC38A1), and SNAT2 (SLC38A2), though SLC1A5 has been reported to have minimal impact on alanine transport (36–38). Compared with other transporters, single-cell transcriptomic data revealed that SLC38A2 was highly expressed in stromal cells, particularly in fibroblasts and myofibroblasts (Figure 4, A and B). Despite previous findings indicating that SLC38A2 mRNA levels are not altered in NHLFs treated with TGF-β for 48 hours (29), our results demonstrated that TGF-β significantly upregulated SLC38A2 protein expression (Figure 4C). Similar to TGF-β alone, a profibrotic cocktail including TGF-β, PDGF-AB, TNF-α, and LPA also induced GPT2 and SLC38A2 expression and increased intracellular alanine levels (Supplemental Figure 4, A and B) (39). Unlike GPT2, the TGF-β–induced upregulation of SLC38A2 protein expression was independent of extracellular glutamine (Figure 4C). Previous studies have shown that SLC38A2 protein expression is induced in response to amino acid deprivation (40). We further discovered that adding alanine to DMEM decreased SLC38A2 protein expression in control and TGF-β–treated cells (Figure 4D). GPT2 knockdown, which decreases intracellular alanine, increased SLC38A2 modestly in FBM (Figure 4E), suggesting a compensatory upregulation of alanine transport in response to impaired intracellular alanine synthesis.
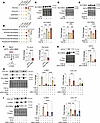 Figure 4
SLC38A2 mediates alanine uptake and myofibroblast differentiation. (A) Normalized transporter expression in lung cell types from the Human Lung Cell Atlas. (B) Fibroblast subset–specific expression in healthy lung samples. Dot color indicates mean expression; size indicates percentage of expressing cells. (C) Western blot analysis and quantification showing that TGF-β significantly upregulates SLC38A2 protein expression in NHLFs, independent of glutamine availability. (D) Western blot analysis and quantification showing that extracellular alanine deprivation promotes SLC38A2 protein expression in DMEM-cultured fibroblasts. (E) Western blot analysis and quantification showing that GPT2 knockdown reduces intracellular alanine levels and shows a trend toward increasing SLC38A2 protein expression in FBM. (F) Schematic overview of the short-term [U-13C3]-alanine-alanine and [15N1]-glutamine co-uptake assay in control and SLC38A2-knockdown fibroblasts and relative quantification of 13C3-alanine and [15N1]-glutamine uptake. (G) Western blot analysis and quantification showing that SLC38A2 knockdown reduces TGF-β–induced GPT2 expression in FBM. (H) Western blot analysis and quantification of α-SMA and COL1A1 expression in control and SLC38A2-knockdown fibroblasts cultured in DMEM for 48 hours with TGF-β stimulation, with or without AOA (1 mM) and/or alanine supplementation (2 mM). (I) Western blot analysis and quantification of α-SMA and COL1A1 expression in FBM-cultured fibroblasts after TGF-β stimulation and combined treatment with AOA and SLC38A2 knockdown for 48 hours. For Western blot analysis, individual data points represent biological replicates. For F, unpaired 2-tailed t test; for C–E and G–I, 1-way ANOVA. Data are presented as mean ± SEM. ns, P > 0.05; *P < 0.05; **P < 0.01; ***P < 0.001; ****P < 0.0001.
To determine the relative contribution of SLC38A2 to alanine uptake, we performed short-term uptake assays using [U-13C3]-alanine in control and SLC38A2-knockdown fibroblasts (Figure 4F). SLC38A2 knockdown decreased alanine import by approximately 3-fold, confirming that the majority of alanine uptake is mediated by SLC38A2 (Figure 4F). Interestingly, glutamine uptake was also suppressed by approximately 50%, confirming the previously reported role of SLC38A2 as a glutamine transporter (Figure 4F) (41). In line with these findings, SLC38A2 knockdown reduced intracellular alanine and glutamine levels by approximately 3- and 2-fold, respectively, after 48 hours in FBM medium (Supplemental Figure 4C). Notably, glutamine import decreased by 30% when cells were supplemented with 2 mM alanine (Supplemental Figure 4D), consistent with prior reports of alanine-mediated competitive inhibition of glutamine uptake (35). Given that SLC38A2 functions both as an alanine and glutamine transporter, and that glutamine regulates GPT2 protein expression (Figure 2B), we hypothesized that SLC38A2 knockdown would further suppress GPT2 expression, and thereby reduce alanine synthesis. As hypothesized, SLC38A2 knockdown significantly attenuated TGF-β–induced GPT2 upregulation in FBM-cultured cells (Figure 4G).
We next explored the role of SLC38A2 in myofibroblast differentiation. In DMEM, SLC38A2 knockdown decreased TGF-β–induced upregulation of α-SMA protein expression (Figure 4H), possibly by limiting glutamine availability, and thereby reducing GPT2-dependent alanine synthesis. This inhibitory effect of SLC38A2 knockdown was potentiated when alanine synthesis was fully blocked by AOA (Figure 4H). Notably, alanine supplementation restored α-SMA protein expression in control cells, but not in SLC38A2-knockdown cells, confirming that SLC38A2 is required for alanine uptake–mediated α-SMA protein upregulation (Figure 4H). COL1A1 protein expression was only modestly affected by SLC38A2 knockdown (Figure 4H). In FBM, SLC38A2 knockdown significantly reduced ACTA2 (encoding α-SMA) expression and modestly decreased COL1A1 mRNA levels, whereas other profibrotic markers were not significantly altered (Supplemental Figure 4E). Consistent with these transcriptional changes, SLC38A2 knockdown attenuated TGF-β–induced α-SMA protein expression, whereas COL1A1 protein levels were less markedly reduced (Figure 4I), suggesting differential sensitivity of these profibrotic markers to SLC38A2-mediated metabolic regulation. To eliminate intracellular alanine, we combined SLC38A2 knockdown with AOA treatment, which resulted in a significant decrease in COL1A1 protein expression (Figure 4I).
Alanine deficiency reprograms myofibroblast metabolism. Myofibroblast differentiation in vitro requires increased glycolysis (9, 42). Notably, GPT2 silencing reduced intracellular alanine levels and impaired glucose uptake, accompanied by decreased expression of the key glucose transporter GLUT1, suggesting that alanine availability may influence glycolytic capacity (Supplemental Figure 5, A and B). To further assess the metabolic consequences of alanine deficiency in myofibroblasts globally, we measured proton efflux rate (PER) and oxygen consumption rate (OCR) after GPT2 knockdown and TGF-β stimulation in DMEM, as indicators of flux through glycolysis and oxidative phosphorylation, respectively. As expected, both PER and OCR were elevated after 48 hours of TGF-β stimulation (Figure 5, A and B, and Supplemental Figure 5, C–F). GPT2 knockdown attenuated these effects, reducing both PER and cellular ATP production, primarily through inhibition of glycolysis (Figure 5, C and D). Consistently, pharmacological inhibition of GPT2 with BCA and CS produced similar reductions in PER and glycolytic ATP production rates (Supplemental Figure 5, G–L).
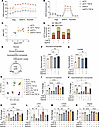 Figure 5
Alanine deficiency reprograms myofibroblast metabolism. (A and B) Proton export rate (PER) and oxygen consumption rate (OCR) in NHLFs treated with TGF-β for 48 hours, with or without GPT2 knockdown. (C and D) ATP production from glycolysis and oxidative phosphorylation in NHLFs treated with TGF-β for 48 hours, with or without GPT2 knockdown. (E) Schematic overview of glycolysis and the TCA cycle. (F and G) NHLFs cultured in glucose-free DMEM supplemented with glutamine, pyruvate, and 8 mM [U-¹³C6]-glucose and treated with TGF-β for 48 hours. GPT2 knockdown reduced ¹³C incorporation into glucose-6-phosphate (G6P) (F) and lactate (G), which were restored by alanine supplementation (2 mM). (H) PCA showing metabolic shifts after GPT2 knockdown and alanine supplementation in TGF-β–treated NHLFs. (I–K) Quantification of intracellular G6P (I), glyceraldehyde-3-phosphate (GAP) (J), and lactate (K) levels in NHLFs after GPT2 knockdown and alanine supplementation. (L–N) Quantification of intracellular TCA cycle intermediates: α-KG (L), citrate (M), and malate (N). In all cases, control cells were transfected with nontargeting (control) siRNA. For D, 2-way ANOVA; F, G, and I–N, 1-way ANOVA with multiple comparisons. A–D show results representative of 3 independent experiments. Data are presented as mean ± SEM. ns, P > 0.05; *P < 0.05; **P < 0.01; ***P < 0.001; ****P < 0.0001.
To further elucidate the metabolic alterations in glycolysis after TGF-β treatment in the context of GPT2 knockdown, we conducted metabolic stable-isotope tracing studies (Figure 5E). Lung fibroblasts were cultured in glucose-free DMEM supplemented with [U-13C6]-glucose (8 mM) and stimulated with TGF-β for 48 hours. GPT2 knockdown reduced TGF-β–induced labeling of glucose-6-phosphate (G6P), while alanine fully restored G6P labeling (Figure 5F). Alanine also increased lactate labeling under GPT2 knockdown conditions, although this increase did not reach statistical significance (Figure 5G). Metabolomic analysis further confirmed that GPT2 knockdown reshaped the intracellular metabolome, as indicated by the distinct clustering of experimental groups in the PCA plot (Figure 5H). Moreover, alanine-supplemented control and GPT2 knockdown overlapped, suggesting metabolic rescue (Figure 5H). Specifically, relative to cells transfected with control siRNA (siCTL), siGPT2 decreased G6P, glyceraldehyde-3-phosphate, and lactate after TGF-β stimulation, all of which were restored by alanine (Figure 5, I–K). Additionally, GPT2 inhibition decreased the abundance of several TCA cycle intermediates (e.g., α-KG, malate, and citrate), while alanine partially rescued their levels (Figure 5, L–N). These findings further support an alanine-dependent role for GPT2 in sustaining glycolytic and TCA cycle metabolite levels, key metabolic features previously associated with myofibroblast differentiation (8).
Alanine metabolism compensates for glutamine deficiency. Myofibroblast differentiation involves both enhanced glycolysis and glutaminolysis (8). Glutamine contributes to proline biosynthesis, a process required for TGF-β–induced extracellular matrix expression (14, 43). GPT2 knockdown decreased glutamate and proline after TGF-β treatment. These reductions were fully restored upon alanine supplementation (Supplemental Figure 6, A and B). Given this observation, we hypothesized that alanine may serve as an alternative carbon and nitrogen source for central metabolic intermediates required for myofibroblast differentiation, particularly during partial or complete glutamine deprivation. To test this, we performed stable isotope tracing using [U-13C3]- or [15N]-alanine in DMEM supplemented with 2 mM glutamine after TGF-β stimulation (Figure 6A). Transamination of [U-13C3]-alanine produces 13C3-pyruvate, which can be reduced to 13C3-lactate by lactate dehydrogenase. Alternatively, 13C3-pyruvate can be oxidized to 13C2-acetyl-CoA by pyruvate dehydrogenase or to 13C3-oxaloacetate by pyruvate carboxylase, yielding 13C2- and 13C3-citrate, respectively. Similarly, transamination of [15N]-alanine generates [15N]-glutamate (Figure 6B). Our data showed that, in the absence of TGF-β, approximately 90% of the total intracellular alanine pool was derived from exogenous [U-13C3]-alanine (Figure 6C). TGF-β treatment decreased the labeling enrichment of alanine to approximately 60%, suggesting increased endogenous alanine synthesis from unlabeled substrates during myofibroblast differentiation (Figure 6C). Only a very small fraction of labeled lactate (~2%) was detected (Figure 6D), in line with previous findings that show alanine to be a minor contributor to the total intracellular lactate pool (44). Instead, citrate showed substantial 13C-label enrichment (~15% and ~40% in the absence or presence of TGF-β, respectively) (Figure 6E and Supplemental Figure 7A), suggesting that a greater fraction of the total citrate pool, when compared with the total lactate pool, is derived from alanine. Interestingly, under glutamine-deficient conditions, TGF-β stimulation increased the labeling of glutamate (~10% to ~40%), proline (~10% to ~25%), glutamine (~10% to ~25%), malate (~5% to ~10%), and aspartate (~10% to ~20%), indicating alanine can be an important alternative carbon source for these metabolites (Figure 6, F and G, and Supplemental Figure 7, B–D).
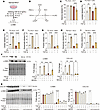 Figure 6
Alanine sustains myofibroblast differentiation by compensating for glutamine deficiency. (A) Schematic overview of isotope tracing experiments using [U-13C3]-alanine or [15N]-alanine in NHLFs treated with TGF-β in DMEM with or without 2 mM glutamine (n = 5 per group). (B) Expected metabolic fate of alanine. (C) Percentage of 13C3-labeled alanine relative to total intracellular alanine derived from extracellular [U-13C3]-alanine under baseline conditions and after TGF-β stimulation. (D–G) Fractional label enrichment of lactate (D), citrate (E), glutamate (F), and proline (G) from [U-13C3]-alanine in NHLFs after TGF-β stimulation for 48 hours. (H and I) Fractional label enrichment of 15N-glutamate (H) and 15N-proline (I) from 15N-alanine under glutamine-sufficient and glutamine-deficient conditions after TGF-β treatment for 48 hours. (J) Western blot analysis and quantification of α-SMA and COL1A1 expression in fibroblasts cultured in DMEM with or without glutamine after supplementation with a nonessential amino acid (NEAA) cocktail for 48 hours. (K) Western blot and quantification of α-SMA and COL1A1 expression after individual supplementation of NEAAs (2 mm) in DMEM with or without glutamine. For Western blot analysis, individual data points represent biological replicates. For C–J, 1-way ANOVA with multiple comparisons; for K, 1-way ANOVA versus Gln– TGF-β. Data are presented as mean ± SEM. ns, P > 0.05; **P < 0.01; ***P < 0.001; ****P < 0.0001.
In the [15N]-alanine experiment, approximately 10% of the total glutamate and proline pools were 15N-labeled under glutamine-sufficient conditions after TGF-β stimulation, and 15N labeling enrichment increased substantially during glutamine deprivation (~35% for glutamine and glutamate, and ~25% for proline) (Figure 6, H and I, and Supplemental Figure 7E), demonstrating reverse GPT2 flux allowing transamination of α-KG for glutamate and glutamine production.
Since the enhanced synthesis of proline from glutamine facilitates TGF-β–induced matrix protein production, we next investigated whether alanine could compensate for glutamine deficiency to maintain α-SMA and COL1A1 expression. We first applied a commercial NEAA cocktail, which was sufficient to partly rescue AOA-induced inhibition of TGF-β–stimulated α-SMA and COL1A1 protein expression (Supplemental Table 2 and Supplemental Figure 7F). Under glutamine-deficient conditions, α-SMA and COL1A1 protein expression was attenuated after TGF-β stimulation (Figure 6J). The NEAA cocktail partially restored α-SMA protein expression, while only modestly increasing COL1A1 production (Figure 6J). Next, we supplemented each NEAA individually. Only alanine partially restored the α-SMA protein expression, with minimal change in the COL1A1 protein (Figure 6K). These data identify a unique and critical role for alanine as a carbon and nitrogen source for central metabolic intermediates, which may support myofibroblast differentiation under glutamine-deprived conditions.
SLC38A2 and GPT2 cooperate to drive myofibroblast function and fibrogenic protein expression. Based on the cooperative regulation of alanine metabolism by GPT2 and SLC38A2 and their essential roles in promoting myofibroblast differentiation, we assessed their clinical relevance in IPF, examined key myofibroblast functional and metabolic phenotypes, and explored their potential as therapeutic targets. In a publicly available whole-lung RNA-Seq dataset (GSE32537), we examined the relationship between SLC38A2 and GPT2 expression and lung function (45). Increased SLC38A2 expression, but not GPT2 expression, correlated with more impaired lung function as measured by forced vital capacity (Figure 7A and Supplemental Figure 8A).
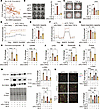 Figure 7
SLC38A2 and GPT2 cooperatively promote TGF-β–induced fibrogenic responses. (A) Pearson’s correlation between SLC38A2 mRNA levels and forced vital capacity (FVC) predicted for each patient, from clinical data of GSE32537. (B) Representative images of collagen gel contraction after 24 hours of TGF-β treatment in FBM with or without SLC38A2 knockdown (left). Quantification of gel contraction expressed as the percentage reduction in gel area relative to baseline (0 h) (right). (C) Representative images of control and SLC38A2-knockdown NHLFs migrating into the cell-free zone 24 hours after TGF-β treatment in FBM (left). Quantification of migrated cells within the defined area based on DAPI staining (right). (D–G) PER (D), glycolytic capacity (E), OCR (F), and spare respiratory capacity (G) in NHLFs after 48 hours of TGF-β treatment in FBM, with or without SLC38A2 knockdown. (H–L) Quantification of intracellular G6P (H), lactate (I), α-KG (J), glutamate (K), and proline (L) levels in NHLFs after SLC38A2 knockdown and TGF-β treatment. (M) Western blot analysis and quantification of α-SMA and COL1A1 expression in NHLFs treated with TGF-β for 48 hours, with or without SLC38A2 knockdown and β-chloro-L-alanine (BCA, 100 μM) treatment. (N) Immunofluorescence staining and quantification of α-SMA and COL1A1 expression in IPF patient-derived fibroblasts after SLC38A2 knockdown and BCA (100 μM) treatment under TGF-β stimulation (n = 8 per group). For Western blot analysis, individual data points represent biological replicates. B–G and N show results representative of 3 independent experiments. For A, linear regression and Pearson’s correlation. For B, C, E, G, and H–N, 1-way ANOVA. Data are presented as mean ± SEM. ns, P > 0.05; *P < 0.05; **P < 0.01; ****P < 0.0001.
Myofibroblast differentiation is characterized by enhanced contractile capacity, with α-SMA playing a key role in maximal force generation (7, 46). Since SLC38A2 knockdown reduces alanine uptake and limits glutamine for GPT2-dependent alanine synthesis, thereby impairing α-SMA expression (Figure 4G), we hypothesized that SLC38A2 inhibition may attenuate myofibroblast contractile function. To test this hypothesis, we evaluated SLC38A2 function in TGF-β–treated fibroblasts cultured in FBM using a collagen gel contraction assay, a functional readout of myofibroblast-mediated matrix contraction. SLC38A2 knockdown significantly reduced TGF-β–induced gel contraction to near baseline levels (Figure 7B). We also measured fibroblast migratory capacity under the same conditions and found that siSLC38A2 markedly decreased migration to levels comparable to unstimulated controls (Figure 7C). These functional impairments were accompanied by reductions in both PER and OCR (Figure 7, D–G, and Supplemental Figure 8, B and C), along with decreased levels of G6P, lactate, α-KG, glutamate, and proline (Figure 7, H–L), indicating that SLC38A2 links amino acid transport to bioenergetic and anabolic programs required for myofibroblast differentiation.
Given that SLC38A2 knockdown only partially reduced GPT2 protein expression, it failed to fully block alanine synthesis (Figure 4G). We further explored the feasibility of targeting both alanine synthesis and uptake simultaneously to ameliorate pulmonary fibrosis. We attempted pharmacological inhibition of both targets to facilitate future translation to animal models and to avoid transfection reagents. GPT2 inhibition was achieved using BCA, which was validated by metabolomic profiling and recapitulated the effects observed with GPT2 knockdown (Figure 3). For SLC38A2 inhibition, the neutral amino acid transporter inhibitor MeAIB has been reported; however, its specificity for SLC38A2 and its efficacy in blocking alanine uptake under nutrient-replete conditions remain uncertain (47, 48). We performed short-term labeled alanine and glutamine uptake assays and found that MeAIB (up to 50 mM) did not inhibit alanine or glutamine import (Supplemental Figure 8D). Consistently, MeAIB treatment did not reproduce the phenotypic effects observed with SLC38A2 knockdown, as confirmed by Western blot (Supplemental Figure 8E), immunofluorescence (Supplemental Figure 8F), and functional assays (Supplemental Figure 8, G and H) in FBM. Therefore, we relied on siRNA-mediated knockdown combined with BCA. Our results show that SLC38A2 knockdown in NHLFs suppressed TGF-β–induced α-SMA protein expression in FBM, and that this suppression was potentiated in the presence of BCA-mediated GPT inhibition (Figure 7M). Combined SLC38A2 knockdown and BCA treatment also significantly reduced COL1A1 protein expression (Figure 7M). To validate these findings in a disease-relevant context, we performed immunofluorescence staining in fibroblasts derived from patients with IPF in FBM. The data showed a similar inhibitory effect on α-SMA and COL1A1 protein expression of SLC38A2 knockdown combined with BCA treatment (Figure 7N). These findings collectively demonstrate that dual inhibition of alanine synthesis and transport markedly attenuates TGF-β–induced fibrogenic protein expression.
Combined inhibition of alanine synthesis and uptake attenuates pulmonary fibrosis. To extend our findings to a more physiologically relevant model, we employed precision-cut lung slices (PCLS), which preserve the native lung architecture and multicellular microenvironment, including both airway and alveolar compartments, making them highly valuable for studying fibrotic pathogenesis, pharmacological responses, and therapeutic discovery in pulmonary fibrosis (49–51). As illustrated in Figure 8A, commercially available PCLS from nondiseased human donors were cultured, transfected with SLC38A2 siRNA, and treated with TGF-β and BCA in DMEM/F-12 medium, which contains both alanine and glutamine (Supplemental Table 3).
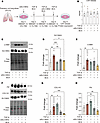 Figure 8
Dual inhibition of alanine uptake and synthesis alleviates pulmonary fibrosis. (A) Schematic overview of experiments using commercially available precision-cut lung slices (PCLS) derived from healthy donors to investigate the role of GPT inhibition and SLC38A2 knockdown in pulmonary fibrosis. In all cases, control PCLS were transfected with nontargeting (control) siRNA. (B) Supernatants collected from day 6 to day 8 were subjected to LDH assay. Each color represents an independent biological replicate. (C–E) Western blot analysis (C) and quantification of SLC38A2 (D) and α-SMA (E) expression in PCLS after TGF-β stimulation with or without SLC38A2 knockdown and BCA (250 μM) treatment. (F–H) Western blot analysis (F) and quantification of COL1A1 (G) and fibronectin (FN) (H) expression in PCLS after combined SLC38A2 knockdown and BCA (250 μM) treatment. For Western blot analysis, individual data points represent biological replicates. For D, E, G, and H, 1-way ANOVA versus TGF-β. Data are presented as mean ± SEM. ns, P > 0.05; *P < 0.05; **P < 0.01; ***P < 0.001.
Previous studies have demonstrated that PCLS can be maintained for up to 14 days while preserving tissue integrity and metabolic activity (52, 53). After treatment with inhibitors or siRNA, our data showed that PCLS remained responsive to TGF-β. To assess tissue viability under our experimental conditions, we measured LDH release in PCLS culture supernatants as an indicator of cellular injury. LDH release was comparable across all experimental groups, indicating preserved tissue viability throughout the culture period (Figure 8B). Consistent with our in vitro findings, SLC38A2 protein expression was upregulated after TGF-β treatment in PCLS, which was suppressed by SLC38A2 knockdown (Figure 8, C and D). TGF-β also induced key fibrogenic proteins in PCLS, including α-SMA, COL1A1, and fibronectin (Figure 8, E, G, and H). In combination with BCA, SLC38A2 knockdown significantly decreased α-SMA protein levels (Figure 8, C and E). Notably, BCA alone decreased COL1A1 upregulation after TGF-β treatment; the combined intervention potentiated the decrease in both COL1A1 and fibronectin protein expression (Figure 8, F–H). Collectively, these results show that combined inhibition of alanine synthesis and uptake effectively ameliorates pulmonary fibrosis after TGF-β treatment ex vivo.


