
Research ArticleGastroenterology
Open Access |  10.1172/jci.insight.199226
Macrophage signaling associates with fibrogenic program activation in periductal fibroblasts in pediatric primary sclerosing cholangitis
Yunguan Wang,1,2,3,4 David Adeleke,1 Xiangfei Xie,1 Zi F. Yang,3,5 Xiangya Wang,6 Giulia Loi,7 Annika Yang vom Hofe,1 Manavi Singh,1 Astha Malik,1 Ramesh Kudira,1 Cyd Castro-Rojas,1 Liva Pfuhler,1 Mosab Alquraish,1 Pamela Sylvestre,8,9 Jonathan R. Dillman,10 Andrew T. Trout,10 Emily R. Miraldi,3,11 and Alexander G. Miethke1,4
1Division of Pediatric Gastroenterology, Hepatology and Nutrition,
2Division of Human Genetics, and
3Divisions of Immunobiology and Biomedical Informatics, Cincinnati Children’s Hospital Medical Center, Cincinnati, Ohio, USA.
4Department of Pediatrics, University of Cincinnati College of Medicine, Cincinnati, Ohio, USA.
5Molecular Developmental Biology Graduate Program, Cincinnati Children’s Hospital Medical Center, Cincinnati, Ohio, USA.
6Department of Mathematical Sciences, University of Cincinnati, Cincinnati, Ohio, USA.
7Biomedical Informatics Graduate Program and
8Division of Pathology and Laboratory Medicine, Cincinnati Children’s Hospital Medical Center, Cincinnati, Ohio, USA.
9Department of Pathology and Laboratory Medicine, University of Cincinnati College of Medicine, Cincinnati, Ohio, USA.
10Department of Radiology, Cincinnati Children’s Hospital Medical Center and University of Cincinnati College of Medicine, Cincinnati, Ohio, USA.
11Divisions of Immunobiology and Biomedical Informatics, Cincinnati Children’s Hospital Medical Center, Cincinnati, Ohio, USA.
Address correspondence to: Yunguan Wang or Alexander G. Miethke, 3333 Burnet Avenue, Cincinnati, Ohio 45229-3026, USA. Email: Yunguan.wang@cchmc.org (YW); Alexander.miethke@cchmc.org (AGM).
Find articles by Wang, Y. in: PubMed | Google Scholar
1Division of Pediatric Gastroenterology, Hepatology and Nutrition,
2Division of Human Genetics, and
3Divisions of Immunobiology and Biomedical Informatics, Cincinnati Children’s Hospital Medical Center, Cincinnati, Ohio, USA.
4Department of Pediatrics, University of Cincinnati College of Medicine, Cincinnati, Ohio, USA.
5Molecular Developmental Biology Graduate Program, Cincinnati Children’s Hospital Medical Center, Cincinnati, Ohio, USA.
6Department of Mathematical Sciences, University of Cincinnati, Cincinnati, Ohio, USA.
7Biomedical Informatics Graduate Program and
8Division of Pathology and Laboratory Medicine, Cincinnati Children’s Hospital Medical Center, Cincinnati, Ohio, USA.
9Department of Pathology and Laboratory Medicine, University of Cincinnati College of Medicine, Cincinnati, Ohio, USA.
10Department of Radiology, Cincinnati Children’s Hospital Medical Center and University of Cincinnati College of Medicine, Cincinnati, Ohio, USA.
11Divisions of Immunobiology and Biomedical Informatics, Cincinnati Children’s Hospital Medical Center, Cincinnati, Ohio, USA.
Address correspondence to: Yunguan Wang or Alexander G. Miethke, 3333 Burnet Avenue, Cincinnati, Ohio 45229-3026, USA. Email: Yunguan.wang@cchmc.org (YW); Alexander.miethke@cchmc.org (AGM).
Find articles by Adeleke, D. in: PubMed | Google Scholar
1Division of Pediatric Gastroenterology, Hepatology and Nutrition,
2Division of Human Genetics, and
3Divisions of Immunobiology and Biomedical Informatics, Cincinnati Children’s Hospital Medical Center, Cincinnati, Ohio, USA.
4Department of Pediatrics, University of Cincinnati College of Medicine, Cincinnati, Ohio, USA.
5Molecular Developmental Biology Graduate Program, Cincinnati Children’s Hospital Medical Center, Cincinnati, Ohio, USA.
6Department of Mathematical Sciences, University of Cincinnati, Cincinnati, Ohio, USA.
7Biomedical Informatics Graduate Program and
8Division of Pathology and Laboratory Medicine, Cincinnati Children’s Hospital Medical Center, Cincinnati, Ohio, USA.
9Department of Pathology and Laboratory Medicine, University of Cincinnati College of Medicine, Cincinnati, Ohio, USA.
10Department of Radiology, Cincinnati Children’s Hospital Medical Center and University of Cincinnati College of Medicine, Cincinnati, Ohio, USA.
11Divisions of Immunobiology and Biomedical Informatics, Cincinnati Children’s Hospital Medical Center, Cincinnati, Ohio, USA.
Address correspondence to: Yunguan Wang or Alexander G. Miethke, 3333 Burnet Avenue, Cincinnati, Ohio 45229-3026, USA. Email: Yunguan.wang@cchmc.org (YW); Alexander.miethke@cchmc.org (AGM).
Find articles by Xie, X. in: PubMed | Google Scholar
1Division of Pediatric Gastroenterology, Hepatology and Nutrition,
2Division of Human Genetics, and
3Divisions of Immunobiology and Biomedical Informatics, Cincinnati Children’s Hospital Medical Center, Cincinnati, Ohio, USA.
4Department of Pediatrics, University of Cincinnati College of Medicine, Cincinnati, Ohio, USA.
5Molecular Developmental Biology Graduate Program, Cincinnati Children’s Hospital Medical Center, Cincinnati, Ohio, USA.
6Department of Mathematical Sciences, University of Cincinnati, Cincinnati, Ohio, USA.
7Biomedical Informatics Graduate Program and
8Division of Pathology and Laboratory Medicine, Cincinnati Children’s Hospital Medical Center, Cincinnati, Ohio, USA.
9Department of Pathology and Laboratory Medicine, University of Cincinnati College of Medicine, Cincinnati, Ohio, USA.
10Department of Radiology, Cincinnati Children’s Hospital Medical Center and University of Cincinnati College of Medicine, Cincinnati, Ohio, USA.
11Divisions of Immunobiology and Biomedical Informatics, Cincinnati Children’s Hospital Medical Center, Cincinnati, Ohio, USA.
Address correspondence to: Yunguan Wang or Alexander G. Miethke, 3333 Burnet Avenue, Cincinnati, Ohio 45229-3026, USA. Email: Yunguan.wang@cchmc.org (YW); Alexander.miethke@cchmc.org (AGM).
Find articles by Yang, Z. in: PubMed | Google Scholar
1Division of Pediatric Gastroenterology, Hepatology and Nutrition,
2Division of Human Genetics, and
3Divisions of Immunobiology and Biomedical Informatics, Cincinnati Children’s Hospital Medical Center, Cincinnati, Ohio, USA.
4Department of Pediatrics, University of Cincinnati College of Medicine, Cincinnati, Ohio, USA.
5Molecular Developmental Biology Graduate Program, Cincinnati Children’s Hospital Medical Center, Cincinnati, Ohio, USA.
6Department of Mathematical Sciences, University of Cincinnati, Cincinnati, Ohio, USA.
7Biomedical Informatics Graduate Program and
8Division of Pathology and Laboratory Medicine, Cincinnati Children’s Hospital Medical Center, Cincinnati, Ohio, USA.
9Department of Pathology and Laboratory Medicine, University of Cincinnati College of Medicine, Cincinnati, Ohio, USA.
10Department of Radiology, Cincinnati Children’s Hospital Medical Center and University of Cincinnati College of Medicine, Cincinnati, Ohio, USA.
11Divisions of Immunobiology and Biomedical Informatics, Cincinnati Children’s Hospital Medical Center, Cincinnati, Ohio, USA.
Address correspondence to: Yunguan Wang or Alexander G. Miethke, 3333 Burnet Avenue, Cincinnati, Ohio 45229-3026, USA. Email: Yunguan.wang@cchmc.org (YW); Alexander.miethke@cchmc.org (AGM).
Find articles by Wang, X. in: PubMed | Google Scholar
1Division of Pediatric Gastroenterology, Hepatology and Nutrition,
2Division of Human Genetics, and
3Divisions of Immunobiology and Biomedical Informatics, Cincinnati Children’s Hospital Medical Center, Cincinnati, Ohio, USA.
4Department of Pediatrics, University of Cincinnati College of Medicine, Cincinnati, Ohio, USA.
5Molecular Developmental Biology Graduate Program, Cincinnati Children’s Hospital Medical Center, Cincinnati, Ohio, USA.
6Department of Mathematical Sciences, University of Cincinnati, Cincinnati, Ohio, USA.
7Biomedical Informatics Graduate Program and
8Division of Pathology and Laboratory Medicine, Cincinnati Children’s Hospital Medical Center, Cincinnati, Ohio, USA.
9Department of Pathology and Laboratory Medicine, University of Cincinnati College of Medicine, Cincinnati, Ohio, USA.
10Department of Radiology, Cincinnati Children’s Hospital Medical Center and University of Cincinnati College of Medicine, Cincinnati, Ohio, USA.
11Divisions of Immunobiology and Biomedical Informatics, Cincinnati Children’s Hospital Medical Center, Cincinnati, Ohio, USA.
Address correspondence to: Yunguan Wang or Alexander G. Miethke, 3333 Burnet Avenue, Cincinnati, Ohio 45229-3026, USA. Email: Yunguan.wang@cchmc.org (YW); Alexander.miethke@cchmc.org (AGM).
Find articles by Loi, G. in: PubMed | Google Scholar
1Division of Pediatric Gastroenterology, Hepatology and Nutrition,
2Division of Human Genetics, and
3Divisions of Immunobiology and Biomedical Informatics, Cincinnati Children’s Hospital Medical Center, Cincinnati, Ohio, USA.
4Department of Pediatrics, University of Cincinnati College of Medicine, Cincinnati, Ohio, USA.
5Molecular Developmental Biology Graduate Program, Cincinnati Children’s Hospital Medical Center, Cincinnati, Ohio, USA.
6Department of Mathematical Sciences, University of Cincinnati, Cincinnati, Ohio, USA.
7Biomedical Informatics Graduate Program and
8Division of Pathology and Laboratory Medicine, Cincinnati Children’s Hospital Medical Center, Cincinnati, Ohio, USA.
9Department of Pathology and Laboratory Medicine, University of Cincinnati College of Medicine, Cincinnati, Ohio, USA.
10Department of Radiology, Cincinnati Children’s Hospital Medical Center and University of Cincinnati College of Medicine, Cincinnati, Ohio, USA.
11Divisions of Immunobiology and Biomedical Informatics, Cincinnati Children’s Hospital Medical Center, Cincinnati, Ohio, USA.
Address correspondence to: Yunguan Wang or Alexander G. Miethke, 3333 Burnet Avenue, Cincinnati, Ohio 45229-3026, USA. Email: Yunguan.wang@cchmc.org (YW); Alexander.miethke@cchmc.org (AGM).
Find articles by Yang vom Hofe, A. in: PubMed | Google Scholar
1Division of Pediatric Gastroenterology, Hepatology and Nutrition,
2Division of Human Genetics, and
3Divisions of Immunobiology and Biomedical Informatics, Cincinnati Children’s Hospital Medical Center, Cincinnati, Ohio, USA.
4Department of Pediatrics, University of Cincinnati College of Medicine, Cincinnati, Ohio, USA.
5Molecular Developmental Biology Graduate Program, Cincinnati Children’s Hospital Medical Center, Cincinnati, Ohio, USA.
6Department of Mathematical Sciences, University of Cincinnati, Cincinnati, Ohio, USA.
7Biomedical Informatics Graduate Program and
8Division of Pathology and Laboratory Medicine, Cincinnati Children’s Hospital Medical Center, Cincinnati, Ohio, USA.
9Department of Pathology and Laboratory Medicine, University of Cincinnati College of Medicine, Cincinnati, Ohio, USA.
10Department of Radiology, Cincinnati Children’s Hospital Medical Center and University of Cincinnati College of Medicine, Cincinnati, Ohio, USA.
11Divisions of Immunobiology and Biomedical Informatics, Cincinnati Children’s Hospital Medical Center, Cincinnati, Ohio, USA.
Address correspondence to: Yunguan Wang or Alexander G. Miethke, 3333 Burnet Avenue, Cincinnati, Ohio 45229-3026, USA. Email: Yunguan.wang@cchmc.org (YW); Alexander.miethke@cchmc.org (AGM).
Find articles by Singh, M. in: PubMed | Google Scholar
1Division of Pediatric Gastroenterology, Hepatology and Nutrition,
2Division of Human Genetics, and
3Divisions of Immunobiology and Biomedical Informatics, Cincinnati Children’s Hospital Medical Center, Cincinnati, Ohio, USA.
4Department of Pediatrics, University of Cincinnati College of Medicine, Cincinnati, Ohio, USA.
5Molecular Developmental Biology Graduate Program, Cincinnati Children’s Hospital Medical Center, Cincinnati, Ohio, USA.
6Department of Mathematical Sciences, University of Cincinnati, Cincinnati, Ohio, USA.
7Biomedical Informatics Graduate Program and
8Division of Pathology and Laboratory Medicine, Cincinnati Children’s Hospital Medical Center, Cincinnati, Ohio, USA.
9Department of Pathology and Laboratory Medicine, University of Cincinnati College of Medicine, Cincinnati, Ohio, USA.
10Department of Radiology, Cincinnati Children’s Hospital Medical Center and University of Cincinnati College of Medicine, Cincinnati, Ohio, USA.
11Divisions of Immunobiology and Biomedical Informatics, Cincinnati Children’s Hospital Medical Center, Cincinnati, Ohio, USA.
Address correspondence to: Yunguan Wang or Alexander G. Miethke, 3333 Burnet Avenue, Cincinnati, Ohio 45229-3026, USA. Email: Yunguan.wang@cchmc.org (YW); Alexander.miethke@cchmc.org (AGM).
Find articles by
Malik, A.
in:
PubMed
|
Google Scholar
|

1Division of Pediatric Gastroenterology, Hepatology and Nutrition,
2Division of Human Genetics, and
3Divisions of Immunobiology and Biomedical Informatics, Cincinnati Children’s Hospital Medical Center, Cincinnati, Ohio, USA.
4Department of Pediatrics, University of Cincinnati College of Medicine, Cincinnati, Ohio, USA.
5Molecular Developmental Biology Graduate Program, Cincinnati Children’s Hospital Medical Center, Cincinnati, Ohio, USA.
6Department of Mathematical Sciences, University of Cincinnati, Cincinnati, Ohio, USA.
7Biomedical Informatics Graduate Program and
8Division of Pathology and Laboratory Medicine, Cincinnati Children’s Hospital Medical Center, Cincinnati, Ohio, USA.
9Department of Pathology and Laboratory Medicine, University of Cincinnati College of Medicine, Cincinnati, Ohio, USA.
10Department of Radiology, Cincinnati Children’s Hospital Medical Center and University of Cincinnati College of Medicine, Cincinnati, Ohio, USA.
11Divisions of Immunobiology and Biomedical Informatics, Cincinnati Children’s Hospital Medical Center, Cincinnati, Ohio, USA.
Address correspondence to: Yunguan Wang or Alexander G. Miethke, 3333 Burnet Avenue, Cincinnati, Ohio 45229-3026, USA. Email: Yunguan.wang@cchmc.org (YW); Alexander.miethke@cchmc.org (AGM).
Find articles by Kudira, R. in: PubMed | Google Scholar
1Division of Pediatric Gastroenterology, Hepatology and Nutrition,
2Division of Human Genetics, and
3Divisions of Immunobiology and Biomedical Informatics, Cincinnati Children’s Hospital Medical Center, Cincinnati, Ohio, USA.
4Department of Pediatrics, University of Cincinnati College of Medicine, Cincinnati, Ohio, USA.
5Molecular Developmental Biology Graduate Program, Cincinnati Children’s Hospital Medical Center, Cincinnati, Ohio, USA.
6Department of Mathematical Sciences, University of Cincinnati, Cincinnati, Ohio, USA.
7Biomedical Informatics Graduate Program and
8Division of Pathology and Laboratory Medicine, Cincinnati Children’s Hospital Medical Center, Cincinnati, Ohio, USA.
9Department of Pathology and Laboratory Medicine, University of Cincinnati College of Medicine, Cincinnati, Ohio, USA.
10Department of Radiology, Cincinnati Children’s Hospital Medical Center and University of Cincinnati College of Medicine, Cincinnati, Ohio, USA.
11Divisions of Immunobiology and Biomedical Informatics, Cincinnati Children’s Hospital Medical Center, Cincinnati, Ohio, USA.
Address correspondence to: Yunguan Wang or Alexander G. Miethke, 3333 Burnet Avenue, Cincinnati, Ohio 45229-3026, USA. Email: Yunguan.wang@cchmc.org (YW); Alexander.miethke@cchmc.org (AGM).
Find articles by Castro-Rojas, C. in: PubMed | Google Scholar
1Division of Pediatric Gastroenterology, Hepatology and Nutrition,
2Division of Human Genetics, and
3Divisions of Immunobiology and Biomedical Informatics, Cincinnati Children’s Hospital Medical Center, Cincinnati, Ohio, USA.
4Department of Pediatrics, University of Cincinnati College of Medicine, Cincinnati, Ohio, USA.
5Molecular Developmental Biology Graduate Program, Cincinnati Children’s Hospital Medical Center, Cincinnati, Ohio, USA.
6Department of Mathematical Sciences, University of Cincinnati, Cincinnati, Ohio, USA.
7Biomedical Informatics Graduate Program and
8Division of Pathology and Laboratory Medicine, Cincinnati Children’s Hospital Medical Center, Cincinnati, Ohio, USA.
9Department of Pathology and Laboratory Medicine, University of Cincinnati College of Medicine, Cincinnati, Ohio, USA.
10Department of Radiology, Cincinnati Children’s Hospital Medical Center and University of Cincinnati College of Medicine, Cincinnati, Ohio, USA.
11Divisions of Immunobiology and Biomedical Informatics, Cincinnati Children’s Hospital Medical Center, Cincinnati, Ohio, USA.
Address correspondence to: Yunguan Wang or Alexander G. Miethke, 3333 Burnet Avenue, Cincinnati, Ohio 45229-3026, USA. Email: Yunguan.wang@cchmc.org (YW); Alexander.miethke@cchmc.org (AGM).
Find articles by Pfuhler, L. in: PubMed | Google Scholar
1Division of Pediatric Gastroenterology, Hepatology and Nutrition,
2Division of Human Genetics, and
3Divisions of Immunobiology and Biomedical Informatics, Cincinnati Children’s Hospital Medical Center, Cincinnati, Ohio, USA.
4Department of Pediatrics, University of Cincinnati College of Medicine, Cincinnati, Ohio, USA.
5Molecular Developmental Biology Graduate Program, Cincinnati Children’s Hospital Medical Center, Cincinnati, Ohio, USA.
6Department of Mathematical Sciences, University of Cincinnati, Cincinnati, Ohio, USA.
7Biomedical Informatics Graduate Program and
8Division of Pathology and Laboratory Medicine, Cincinnati Children’s Hospital Medical Center, Cincinnati, Ohio, USA.
9Department of Pathology and Laboratory Medicine, University of Cincinnati College of Medicine, Cincinnati, Ohio, USA.
10Department of Radiology, Cincinnati Children’s Hospital Medical Center and University of Cincinnati College of Medicine, Cincinnati, Ohio, USA.
11Divisions of Immunobiology and Biomedical Informatics, Cincinnati Children’s Hospital Medical Center, Cincinnati, Ohio, USA.
Address correspondence to: Yunguan Wang or Alexander G. Miethke, 3333 Burnet Avenue, Cincinnati, Ohio 45229-3026, USA. Email: Yunguan.wang@cchmc.org (YW); Alexander.miethke@cchmc.org (AGM).
Find articles by Alquraish, M. in: PubMed | Google Scholar
1Division of Pediatric Gastroenterology, Hepatology and Nutrition,
2Division of Human Genetics, and
3Divisions of Immunobiology and Biomedical Informatics, Cincinnati Children’s Hospital Medical Center, Cincinnati, Ohio, USA.
4Department of Pediatrics, University of Cincinnati College of Medicine, Cincinnati, Ohio, USA.
5Molecular Developmental Biology Graduate Program, Cincinnati Children’s Hospital Medical Center, Cincinnati, Ohio, USA.
6Department of Mathematical Sciences, University of Cincinnati, Cincinnati, Ohio, USA.
7Biomedical Informatics Graduate Program and
8Division of Pathology and Laboratory Medicine, Cincinnati Children’s Hospital Medical Center, Cincinnati, Ohio, USA.
9Department of Pathology and Laboratory Medicine, University of Cincinnati College of Medicine, Cincinnati, Ohio, USA.
10Department of Radiology, Cincinnati Children’s Hospital Medical Center and University of Cincinnati College of Medicine, Cincinnati, Ohio, USA.
11Divisions of Immunobiology and Biomedical Informatics, Cincinnati Children’s Hospital Medical Center, Cincinnati, Ohio, USA.
Address correspondence to: Yunguan Wang or Alexander G. Miethke, 3333 Burnet Avenue, Cincinnati, Ohio 45229-3026, USA. Email: Yunguan.wang@cchmc.org (YW); Alexander.miethke@cchmc.org (AGM).
Find articles by Sylvestre, P. in: PubMed | Google Scholar
1Division of Pediatric Gastroenterology, Hepatology and Nutrition,
2Division of Human Genetics, and
3Divisions of Immunobiology and Biomedical Informatics, Cincinnati Children’s Hospital Medical Center, Cincinnati, Ohio, USA.
4Department of Pediatrics, University of Cincinnati College of Medicine, Cincinnati, Ohio, USA.
5Molecular Developmental Biology Graduate Program, Cincinnati Children’s Hospital Medical Center, Cincinnati, Ohio, USA.
6Department of Mathematical Sciences, University of Cincinnati, Cincinnati, Ohio, USA.
7Biomedical Informatics Graduate Program and
8Division of Pathology and Laboratory Medicine, Cincinnati Children’s Hospital Medical Center, Cincinnati, Ohio, USA.
9Department of Pathology and Laboratory Medicine, University of Cincinnati College of Medicine, Cincinnati, Ohio, USA.
10Department of Radiology, Cincinnati Children’s Hospital Medical Center and University of Cincinnati College of Medicine, Cincinnati, Ohio, USA.
11Divisions of Immunobiology and Biomedical Informatics, Cincinnati Children’s Hospital Medical Center, Cincinnati, Ohio, USA.
Address correspondence to: Yunguan Wang or Alexander G. Miethke, 3333 Burnet Avenue, Cincinnati, Ohio 45229-3026, USA. Email: Yunguan.wang@cchmc.org (YW); Alexander.miethke@cchmc.org (AGM).
Find articles by Dillman, J. in: PubMed | Google Scholar
1Division of Pediatric Gastroenterology, Hepatology and Nutrition,
2Division of Human Genetics, and
3Divisions of Immunobiology and Biomedical Informatics, Cincinnati Children’s Hospital Medical Center, Cincinnati, Ohio, USA.
4Department of Pediatrics, University of Cincinnati College of Medicine, Cincinnati, Ohio, USA.
5Molecular Developmental Biology Graduate Program, Cincinnati Children’s Hospital Medical Center, Cincinnati, Ohio, USA.
6Department of Mathematical Sciences, University of Cincinnati, Cincinnati, Ohio, USA.
7Biomedical Informatics Graduate Program and
8Division of Pathology and Laboratory Medicine, Cincinnati Children’s Hospital Medical Center, Cincinnati, Ohio, USA.
9Department of Pathology and Laboratory Medicine, University of Cincinnati College of Medicine, Cincinnati, Ohio, USA.
10Department of Radiology, Cincinnati Children’s Hospital Medical Center and University of Cincinnati College of Medicine, Cincinnati, Ohio, USA.
11Divisions of Immunobiology and Biomedical Informatics, Cincinnati Children’s Hospital Medical Center, Cincinnati, Ohio, USA.
Address correspondence to: Yunguan Wang or Alexander G. Miethke, 3333 Burnet Avenue, Cincinnati, Ohio 45229-3026, USA. Email: Yunguan.wang@cchmc.org (YW); Alexander.miethke@cchmc.org (AGM).
Find articles by Trout, A. in: PubMed | Google Scholar
1Division of Pediatric Gastroenterology, Hepatology and Nutrition,
2Division of Human Genetics, and
3Divisions of Immunobiology and Biomedical Informatics, Cincinnati Children’s Hospital Medical Center, Cincinnati, Ohio, USA.
4Department of Pediatrics, University of Cincinnati College of Medicine, Cincinnati, Ohio, USA.
5Molecular Developmental Biology Graduate Program, Cincinnati Children’s Hospital Medical Center, Cincinnati, Ohio, USA.
6Department of Mathematical Sciences, University of Cincinnati, Cincinnati, Ohio, USA.
7Biomedical Informatics Graduate Program and
8Division of Pathology and Laboratory Medicine, Cincinnati Children’s Hospital Medical Center, Cincinnati, Ohio, USA.
9Department of Pathology and Laboratory Medicine, University of Cincinnati College of Medicine, Cincinnati, Ohio, USA.
10Department of Radiology, Cincinnati Children’s Hospital Medical Center and University of Cincinnati College of Medicine, Cincinnati, Ohio, USA.
11Divisions of Immunobiology and Biomedical Informatics, Cincinnati Children’s Hospital Medical Center, Cincinnati, Ohio, USA.
Address correspondence to: Yunguan Wang or Alexander G. Miethke, 3333 Burnet Avenue, Cincinnati, Ohio 45229-3026, USA. Email: Yunguan.wang@cchmc.org (YW); Alexander.miethke@cchmc.org (AGM).
Find articles by Miraldi, E. in: PubMed | Google Scholar
1Division of Pediatric Gastroenterology, Hepatology and Nutrition,
2Division of Human Genetics, and
3Divisions of Immunobiology and Biomedical Informatics, Cincinnati Children’s Hospital Medical Center, Cincinnati, Ohio, USA.
4Department of Pediatrics, University of Cincinnati College of Medicine, Cincinnati, Ohio, USA.
5Molecular Developmental Biology Graduate Program, Cincinnati Children’s Hospital Medical Center, Cincinnati, Ohio, USA.
6Department of Mathematical Sciences, University of Cincinnati, Cincinnati, Ohio, USA.
7Biomedical Informatics Graduate Program and
8Division of Pathology and Laboratory Medicine, Cincinnati Children’s Hospital Medical Center, Cincinnati, Ohio, USA.
9Department of Pathology and Laboratory Medicine, University of Cincinnati College of Medicine, Cincinnati, Ohio, USA.
10Department of Radiology, Cincinnati Children’s Hospital Medical Center and University of Cincinnati College of Medicine, Cincinnati, Ohio, USA.
11Divisions of Immunobiology and Biomedical Informatics, Cincinnati Children’s Hospital Medical Center, Cincinnati, Ohio, USA.
Address correspondence to: Yunguan Wang or Alexander G. Miethke, 3333 Burnet Avenue, Cincinnati, Ohio 45229-3026, USA. Email: Yunguan.wang@cchmc.org (YW); Alexander.miethke@cchmc.org (AGM).
Find articles by Miethke, A. in: PubMed | Google Scholar
Published April 23, 2026 - More info
JCI Insight. 2026;11(13):e199226. https://doi.org/10.1172/jci.insight.199226.
© 2026 Wang et al. This work is licensed under the Creative Commons Attribution 4.0 International License. To view a copy of this license, visit http://creativecommons.org/licenses/by/4.0/.
Received: August 21, 2025; Accepted: April 21, 2026

-
Introduction
Primary sclerosing cholangitis (PSC) is a chronic, idiopathic cholestatic liver disease characterized by inflammation and fibrosis of the bile ducts. Although the exact etiology of PSC remains unclear, GWAS have implicated genes highly expressed in lymphocytes and myeloid cells — such as HLA genes, FCRL3, INAVA, PRDM1, CCR6, CD226, and IL12RB1 — as risk factors for developing PSC (1). PSC is a slowly but relentlessly progressive disease in children and adolescents, with 38% and 25% developing portal hypertensive and biliary complications, respectively, within 10 years of disease onset and 14% of patients requiring liver transplantation to prolong survival, as shown in a large, multicenter, retrospective cohort study (2). Unique to children and adolescents is the overlap with autoimmune hepatitis (AIH) in 33% of patients with PSC, whereas patients of all ages are frequently diagnosed with concomitant inflammatory bowel disease (IBD). Current treatments focus on managing symptoms and complications, but no approved therapy effectively halts hepatobiliary fibrosis progression (3).
The development of hepatobiliary fibrosis involves complex interactions between several cell types, including cholangiocytes, fibroblasts (portal fibroblasts and hepatic stellate cells [HSCs]), and immune cells. In mouse models of sclerosing cholangitis, injury to bile duct epithelial cells activates nearby fibroblasts, which then migrate to bile ducts, accelerating liver fibrosis progression (4–7). Both portal fibroblasts and recruited HSCs contribute to biliary fibrosis by adopting a myofibroblast phenotype characterized by ACTA2 upregulation and excessive collagen production in mouse models of PSC (8).
Macrophages also play a critical role in PSC pathogenesis. These cells, known for their diverse functions, have both proinflammatory and fibrogenic properties (6). Macrophages promote inflammation and liver damage by secreting cytokines that recruit and activate other immune cells. Additionally, macrophages contribute directly to fibrosis by activating HSCs and producing fibrogenic cytokines such as TGF-β (5). Although macrophages have been identified as key drivers of hepatobiliary fibrosis in PSC, their precise roles across macrophage subpopulations remain poorly understood. Guicciardi et al. demonstrated that inhibiting macrophage recruitment reduced peribiliary fibro-inflammation in an Mdr2–/– mouse model of sclerosing cholangitis (5). In contrast, in a cholestatic injury model involving bile duct ligation and dietary 3,5-diethoxycarbonyl-1,4-dihydrocollidine, macrophage depletion during early cholestasis induction had no significant impact on fibrosis progression (9, 10).
Recent studies investigating PSC liver immunology in humans revealed that macrophages exist in distinct subtypes, including Kupffer cells, monocyte-like macrophages (MoMPs), and lipid-associated macrophage–like (LAM-like) cells (10, 11). Spatially resolved transcriptomics (SRT) analysis using the Visium platform showed that these macrophage subtypes are distributed differently across the portal-central axis and between scarring and non-scarring regions. However, the limited resolution of the Visium platform leaves gaps in our understanding of how macrophages are spatially organized within fibrotic niches and how their transcriptomic heterogeneity contributes to local fibrotic gene programs.
To address these gaps, we employed a multiomics approach integrating single-cell spatially resolved transcriptomics (scSRT), RNA-Seq, and plasma proteomics data from patients with autoimmune liver disease (AILD) and healthy donors (n = 2, 64, and 108, respectively) across the different platforms to investigate the role of macrophages in fibroblast activation (the workflow is summarized in Figure 1). Using unsupervised cell niche analysis, we identified fibrotic regions in liver biopsies and characterized the macrophage populations enriched within them. We then prioritized key cell-cell communication (CCC) genes that may mediate interactions between macrophages and fibrogenic fibroblasts. We hypothesized that gene programs identified through CCC in scSRT data would also exhibit strong associations in non-spatial data. Consistent with this hypothesis, we confirmed that fibrogenic gene expression in fibroblasts correlates with CCC-associated driver genes in macrophages in PSC scRNA-Seq data and that these fibrotic gene signatures are linked to advanced fibrosis stages in pediatric PSC.
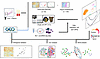 Figure 1
Analytical workflow for scSRT data analysis, integration, CCC prediction, and orthogonal validation.
-
Results
Macrophage activity is correlated with advanced fibrosis in AILD. To investigate the association between macrophage activation and fibrosis-associated transcriptional programs across AILD, we performed RNA-Seq of cryopreserved tissue samples from 64 clinically indicated liver biopsies of pediatric patients with PSC or AIH. These samples were collected at the Center for Autoimmune Liver Disease (CALD) at Cincinnati Children’s Hospital Medical Center, and clinical data are summarized in Table 1. Given the potential biases introduced by tissue heterogeneity and bulk RNA-Seq data, we applied unsupervised clustering to identify common proinflammatory and fibrogenic gene expression patterns. This analysis revealed 3 distinct clusters (Figure 2A): cluster c1 was predominantly composed of PSC samples compared with the other 2 clusters (78.4% vs. 51.1% with PSC, OR = 3.587, P = 0.052, Figure 2B). Notably, cluster c1 was significantly enriched in patients with advanced fibrosis (OR = 6.697, P = 0.002), as defined by a METAVIR score of 2 or higher or an ISHAK score of 3 or higher (Figure 2B). Compared with the rest, patients in c1 exhibited bile duct injuries, as evidenced by higher alkaline phosphatase (ALP) (P = 0.004) and serum γ-glutamyl transferase (GGT) levels (P = 0.07) (Figure 2C). To further explore the relationship between gene expression and fibrosis, we performed Gene Set Enrichment Analysis (GSEA) using genes differentially expressed in cluster c1. We found upregulation of pathways involved in macrophage activation, TGF-β signaling, and collagen formation; genes related to bile and lipid metabolism were among the most downregulated in patients from c1 compared with patients in c0 or c2 (Figure 2D). To further assess macrophage activity in these AILD samples, we calculated the average expression of macrophage-related genes identified in a reference single-cell RNA-Seq (scRNA-Seq) dataset of patients with PSC (10). Genes associated with macrophage activation — including those highly expressed in LAM and MoMP subpopulations — were significantly upregulated in the PSC-dominant cluster c1 (Figure 2E). Genes associated with abundance of LAM included SPP1, FABP5, CSTB, CD9, and GPNMB, whereas VCAN, S100A6, S100A4, LYZ, S100A9, S100A12, and S100A8 identified MoMP. Collectively, these results suggest that macrophage activity is elevated in patients with AILD and advanced fibrosis, potentially contributing to the activation of fibrotic gene programs.
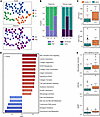 Figure 2
Evaluation of the association between macrophage gene programs and liver fibrosis in PSC. (A) Unsupervised clustering 64 AILD patient samples shown in embeddings calculated using UMAP. Samples are colored based on clusters (upper) or patient diagnosis at the time of data collection (lower). (B) Compositions of each patient sample cluster, based on diagnosis (left) or fibrosis stage (right). (C) Serum GGT and ALP levels in each patient cluster. (D) GSEA results calculated from the ranked DEGs in cluster 1 compared with c0 and c2. Pathways shown were selected based on an FDR q value cutoff of 0.25 and are colored based on the normalized enrichment score (NES). Both the q value and the NES were calculated using the gseapy Python package. (E) Average expression of genes involved in macrophage activation and of marker genes for LAM and MoMPs in each patient cluster. Values were normalized to a numeric range of 0–1. For D and E, significance was obtained from Student’s t test comparing c1 versus the other patient clusters: *P < 0.05, **P < 0.01. Whiskers were extended to 1.5 times IQR from Q1 and Q3.
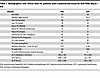 Table 1
Demographics and clinical data for patients with cryopreserved tissue for bulk RNA-Seq (n = 64)
Cell types identified by scSRT recapitulate the cellular landscape of PSC. To investigate the transcriptomic and spatial heterogeneity of these macrophage populations as putative drivers of fibrosis in PSC, we performed scSRT using the VizGen MERSCOPE platform and a custom 400-gene liver immunology panel (Supplemental Table 1; supplemental material available online with this article; https://doi.org/10.1172/jci.insight.199226DS1). Two fresh-cut, archived FFPE slides from diagnostic liver biopsies of 2 patients with pediatric-onset PSC with areas of focal periductal and bridging fibrosis were analyzed. At the time of the liver biopsy, participant A was a 10-year-old female with a new diagnosis of PSC and possible overlap syndrome with AIH and a past medical history of autoimmune pancreatitis and inflammatory bowel disease. Participant B, a 12-year-old male with a history of elevated liver function tests and abnormal liver imaging, was diagnosed with PSC based on the liver biopsy results (Table 2 and Figure 3, A and B). Quality control of the scSRT data included a series of filtering steps based on metrics such as cell size, read counts, and doublet probability. A total of 93,879 cells were retained, with a median per-cell transcript count of 95. To mitigate dropout effects and improve segmentation, we incorporated data denoising and transcript-based re-segmentation in the preprocessing workflow using Sprod (12) and Baysor (13), respectively.
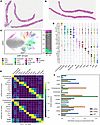 Figure 3
Evaluation of the cell types identified in scSRT PSC samples. (A and B) Overview of the 2 PSC samples used in this study. FFPE slides were stained with H&E. Scale bar: 1 mm. (C) PSC cell types identified using unsupervised clustering shown in embeddings calculated using UMAP. Samples are colored based on cell types. (D) Violin plot showing expression of selected marker genes of each cell type. Each violin is colored based on cell types shown in C. (E) Average expression of top 5 DEGs from each scSRT cell type (rows) in scRNA-Seq cell types (columns) in reference scRNA-Seq (top) and snRNA-Seq (bottom) datasets. Log1p counts per million (CPM) gene expression values were scaled to a range of 0 to 1. (F) Fractions of each cell type among all non-hepatocytes in scSRT and scRNA-Seq data.
Next, we applied unsupervised clustering and identified major PSC-associated cell types using reference PSC cell-type marker genes. These included hepatocytes, cholangiocytes, liver sinusoidal endothelial cells, macrophages, T cells, and HSCs (Figure 3C). Notably, 2 HSC subpopulations emerged: HSC1, characterized by high expression of classical fibrosis genes COL3A1 and COL1A1, and HSC2, which predominantly expressed COL6A1 and CXCL12. Similarly, 3 macrophage populations were identified: LAM, MoMP, and Kupffer cells (Figure 3D). Interestingly, all 3 macrophage subsets exhibited moderate to high expression of the noninflammatory macrophage marker CD163. CD4+ T cells highly expressed naive/central-memory markers including TCF7 and IL7R, and tissue-resident markers including CD69 and CXCR4. This phenotype was consistent with the naive-like T cells previously reported in PSC (14). CD8+ T cells exhibited cytotoxic and central-memory phenotypes, with high expression of GZMK, PRF1, TCF7, and CD69 (Supplemental Figure 1). Additional differentially expressed genes (DEGs;1 vs. rest) are summarized and reported in Supplemental Table 2.
To assess the concordance between cell types identified in scSRT and those from scRNA-Seq, we used scRNA-Seq and single-nuclei RNA-Seq (snRNA-Seq) data from 16 healthy individuals and patients with PSC or primary biliary cholangitis (PBC), with cell-type annotations provided by the original authors (10). We computed the uniform manifold approximation and projection (UMAP) of single cells from 8 patients with PSC, including 7 with decompensated cirrhosis, using only the 400 MERSCOPE genes, and found that cell types remained well-separated (Supplemental Figure 2). Next, we evaluated the expression of marker genes from our scSRT cell types in the 2 reference datasets. As shown in Figure 3E, marker genes identified from scSRT cell types, including CD4/8+ T cells, B cells, macrophages, hepatocytes, and cholangiocytes, were selectively expressed in the corresponding cell types from the scRNA-Seq/snRNA-Seq datasets. Based on the scRNA-Seq dataset, HSC1 from the scSRT corresponded to activated stellate cells, while HSC2 expressed genes found in quiescent stellate cells. These results supported the robustness of the cell-type annotations. We then compared the composition of cell types, excluding hepatocytes, between the 2 liver transcriptomic datasets from patients with PSC. To facilitate interpretation, we grouped HSCs and myofibroblasts into a general fibroblast population. The scRNA-Seq/snRNA-Seq data contained a higher proportion of lymphoid and myeloid cells, whereas scSRT data were enriched with cholangiocytes, endothelial cells, and fibroblasts (Figure 3F). Notably, these results are consistent with earlier IHC- and Visium-based studies showing that T cells, CD163+ macrophages (15), SPP1+ macrophages (16), and LAM-like cells are enriched within fibrotic portal regions, which are themselves encircled by layers of SMA+ myofibroblasts in adult PSC livers (10).
In regions exhibiting onion-skin fibrosis, a characteristic feature of PSC (Figure 4A), we observed concentric layers of LAM-like cells, MoMPs, HSC1 cells, and T cells surrounding the bile ducts (Figure 4B). To quantitatively assess the differential spatial localization of these cell types, we performed a neighborhood enrichment analysis. We found that HSC1 cells, LAM-like cells, MoMPs, and CD4/8+ T cells were significantly enriched around bile duct epithelial cells (at least 168% of expected, P < 0.0001), while HSC2 and Kupffer cells were largely excluded from the cholangiocyte neighborhood (HSC2: 34% of expected; Kupffer cells: 15% of expected, P < 0.0001, Figure 4C).To further characterize these niches, we used CellCharter (17) and identified 2 spatially distinct cell niches (Figure 4D). The first, termed the fibrotic niche, contained a large fraction of HSC1 cells and was enriched in LAM-like cells, MoMPs, and CD4/8+ T cells (Figure 4E). This niche exhibited high expression of genes involved in collagen production, such as COL3A1 and COL1A1, as well as CCL21, a chemoattractant for immune cells (Figure 4F). In contrast, the second niche, termed the nonfibrotic niche, was predominantly composed of hepatocytes and displayed high expression of genes associated with normal liver metabolic functions, including ADH1B and BAAT. Notably, the spatial distribution of the fibrotic niche aligned with periductal regions, represented as regions with enriched cholangiocytes (Supplemental Figure 3).
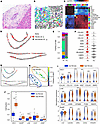 Figure 4
Neighborhood analysis of PSC fibrotic cell niches. (A) A region with onion skin fibrosis on a consecutive slice from the same tissue used in scSRT profiling. (B) A reconstructed image focusing on a region with onion skin fibrosis using scSRT data. Polygons in the image represent segmented cell masks and are colored based on cell types. (C) Heatmap showing neighborhood enrichment scores (NES) between each evaluated neighboring cell type (columns) in the proximity of the reference cell type (rows). Each cell in the heatmap is colored based on the log2(NES) value. (D) Reconstructed image showing the location of each cell in the scSRT data. Cells are shown as dots on the image and colored based on their niche identity. (E) Stacked bar plot showing the fraction of each cell type among all cells in the fibrotic and nonfibrotic niches. (F) Top 5 DEGs for the fibrotic and nonfibrotic niches. Differential analysis was performed using Wilcoxon’s rank-sum test with FDR-adjusted P value cutoff at 0.05. DEGs were ranked using log fold-changes. (G) Reconstructed image of cells in scSRT data showing the location of periductal regions. (H) PCA plot calculated from the pseudo-bulk–level expression profiles from periductal regions. Pseudo-bulks are colored based on HSC1 fraction. (I) Boxplot showing the enrichment of cell types in the high-fibrosis regions compared with the low-fibrosis regions. Significance obtained from Student’s t test across the 2 groups. *P < 0.05, **P < 0.01, ***P < 0.001. (J) Violin plot of genes upregulated in the high-fibrosis periductal regions. Differential analysis was performed in each cell type using Wilcoxon’s rank-sum test. DEGs were filtered based on FDR-adjusted P value cutoff at 0.05 and minimum log fold-change of 0.6. Quartiles are shown inside each violin.
Periductal fibrosis correlates with enriched and transcriptionally reprogrammed HSCs and macrophages. To better understand how the cellular microenvironment influences periductal fibrosis, we examined the cell-type composition and gene expression within individual periductal regions within the fibrotic niche. We defined these regions by grouping cells within a 50 μm radius (equivalent to 4–5 surrounding cells) of a cholangiocyte into bins, excluding those that contained only isolated cholangiocytes. To prevent over-segmentation of a single periductal region, adjacent bins with overlapping cells were merged. This process identified 86 distinct periductal regions (Figure 4G).
To assess the overall transcriptomic profiles of these regions, we pooled cells in each region into pseudo-bulks and performed principal component analysis (PCA). This analysis revealed 2 distinct clusters, primarily driven by differences in the fraction of HSC1 cells (Figure 4H). Based on this distinction, we categorized the regions as high- and low-fibrosis. Notably, HSC1 cells were 2.84-fold enriched in high-fibrosis regions, which also exhibited increased proportions of MoMPs, LAM-like cells, and CD8+ T cells (minimum fold enrichment = 1.74, Figure 4I).
The enrichment of HSC1 cells in high-fibrosis periductal regions was accompanied by elevated expression of fibrosis-associated genes (FDR-adjusted P < 0.05, log fold-change ≥ 0.6, Figure 4J). For example, COL1A1, COL3A1, and COL4A1 — key markers of fibrosis known to be upregulated in PSC (18–20) — showed significantly increased expression. Additionally, Versican (VCAN), a component of the early fibroproliferative matrix that facilitates fibroblast migration and myofibroblast activation (21, 22), as well as macrophage activation via TLRs (23), was upregulated. Notably, these genes exhibited an average 8-fold increase in HSC1 cells from high-fibrosis regions compared with those in low-fibrosis regions. Given the coordinated upregulation of matrix-remodeling and immune-associated genes in HSC1, we next asked whether HSC1 programs in periductal niches were linked to the local macrophage microenvironment. At the periductal-niche level, we related HSC1 gene expression to nearby macrophage abundance and an inflammatory/LAM-like program. The HSC1 genes most strongly associated with these macrophage features included genes with putative roles in matrix remodeling (COL4A1, CCDC80) (24–26) or immune modulation (GREM1, CXCL13) (27–29). Among them, CXCL13 showed a strong positive correlation with both macrophage abundance and the inflammatory/LAM-like program (Supplemental Figure 4A). Importantly, HSC1 was the dominant source of CXCL13 in highly fibrotic niches (Supplemental Figure 4B). Together, these findings suggest that HSC1 cells in fibrotic periductal regions are associated not only with matrix-producing programs but also with a macrophage-enriched local microenvironment.
Although macrophage populations in high- and low-fibrosis periductal regions showed no significant differences in the expression of genes linked to complement activation (C1QA/B/C) or the NF-κB activation complex (TNFAIP2/3, MCL1, GPR183), we observed distinct transcriptional changes associated with macrophage function (FDR-adjusted P < 0.05, log fold-change ≥ 0.6). Specifically, genes involved in macrophage migration (ITGB2, CXCR4, CD53), activation (IFNGR1, LYZ), and fibrotic responses (GPNMB, PSAP, LGMN) were significantly upregulated in LAM-like and MoMP cells within high-fibrosis regions. Together with the association of HSC1-derived CXCL13 with local macrophages, these findings support coordinated remodeling of both HSC1 and macrophage programs in fibrotic periductal niches.
CCC analysis predicts macrophages as a potential driver for fibrogenic HSC activation. The close spatial association between HSC1 and macrophages, along with the upregulation of key fibrogenic genes in HSC1 within the fibrotic niche, suggests a functional link between the gene expression programs of these 2 cell types. To systematically investigate this relationship, we applied the Spacia algorithm to identify CCC between HSC1 and its neighboring cells in the fibrotic niche (30). Spacia prioritizes single-cell-level CCCs by incorporating cell-cell proximity as a constraint and selecting interactions that lead to downstream changes in signal-receiving cells. We predicted CCCs by modeling HSC1 gene expression as a function of signal-sending genes expressed in its neighboring cells, including CD4/8+ T cells, macrophages, and cholangiocytes. Genes selectively expressed in these neighboring cell types were considered candidate signal-sending genes, while genes upregulated in HSC1 served as response candidates. For each signal-response gene pair, we estimated 2 key parameters: the interaction score (β), which reflects the impact of the CCC on response gene expression, and the proximity coefficient (b), which indicates the dependency of CCC on cell proximity. Importantly, because these predictions are made at the gene-expression level, CCC should be interpreted as strong cell proximity–dependent associations between genes expressed in different cells, rather than as evidence of physical interactions between the corresponding protein molecules.
After filtering interactions based on statistical significance (P values of β and b), we identified 236 HSC1-targeting CCCs originating from neighboring cells, with nearly half of these interactions driven by MoMPs or LAM-like cells (Figure 5A). Among the 20 genes in HSC1 potentially upregulated by the sender cells, several were linked to fibrosis-related processes, including collagen formation (COL1A1, COL1A2, COL3A1, COL6A1), PDGF signaling (PDGFRA, PDGFRB, THBS2), extracellular matrix remodeling (BGN, LUM, DPT, VCAN), and chemotaxis (CXCL12). Interestingly, although T cells were associated with genes involved in extracellular organization and PDGF signaling, the major collagen genes linked to liver fibrosis (23) — COL1A1, COL1A2, and COL3A1 — were predominantly associated with macrophage-derived signals (Figure 5B).
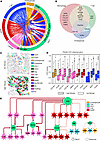 Figure 5
CCC analysis of periductal fibrotic niches in PSC. (A) Circos plot summarizing HSC1-targeting CCC from macrophages, T cells, and cholangiocytes. Each band represents a CCC between the sender cell and HSC1. The bar plot below each gene in the middle track represents the sum of absolute β values of each CCC involving this gene. CCCs were predicted between HSC1 (receiver cell) and macrophages/T cells/cholangiocytes (sender cell). (B) Venn diagram showing the 20 HSC1 genes targeted by sender cells. (C) Reconstructed images of representative low- and high-fibrosis periductal regions. Polygons in the image represent segmented cell masks and are colored based on cell types. CCCs between cells are shown as directed arrows. (D) Comparison of primary instance scores in HSC1 fibrogenic genes between low- and high- fibrosis periductal regions. Colors of bars represent cell types shown in C. *P < 0.05, ***P < 0.001. Whiskers were extended to 1.5 times IQR from Q1 and Q3. (E) CCC network focusing on HSC1 fibrogenic genes. Nodes with spiky borders represent genes expressed by sender cells, and nodes with smooth borders represent HSC1 genes. Nodes are colored based on cell types. CCCs are shown as directed edges, and the absolute β values are positively proportional to edge thickness.
To assess the spatial distribution of these CCCs, we predicted the interaction probability between each macrophage, T cell, and cholangiocyte with HSC1, as estimated by the primary instance score in Spacia. As expected, these CCCs were restricted to cells in close proximity. Moreover, HSC1-targeting CCCs were confined to fibrotic niches in both liver samples and were enriched in high-fibrosis periductal regions (Figure 5C), where HSC1 fibrotic genes — including COL1A1, COL3A1, COL4A1, MMP2, MGP, and VCAN — were upregulated. To further quantify the intensity of CCCs in high- versus low-fibrosis periductal regions, we compared the primary instance scores for each interaction between HSC1 and its neighboring cells. CCCs in high-fibrosis regions exhibited stronger interaction scores across all sender cell types, with macrophage-derived interactions targeting COL1A1, COL3A1, and VCAN displaying the most pronounced differences (Figure 5D). A network representation of these interactions revealed that HSC1 fibrotic gene upregulation was predominantly associated with macrophages, with additional contributions from T cells and cholangiocytes (Figure 5E). Specifically, COL1A1 was primarily associated with LAM-like cells, and its expression in HSC1 cells was positively correlated with genes involved in macrophage activation (GPNMB), TLR signaling (ITGB2), and fibroblast crosstalk (GRN) (31). Meanwhile, COL3A1 was mostly associated with MoMPs and was positively associated with genes linked to inflammatory responses (IFNGR1, POU2F2) and cell recruitment (CXCR4). In summary, macrophage-HSC1 crosstalk is both enriched and intensified in high-fibrosis periductal regions and associated with upregulation of HSC1-derived fibrogenic genes.
Orthogonal validation of fibrotic macrophages and HSC signatures. To validate the role of macrophages in driving fibrogenic gene expression in HSC1 cells, we analyzed both bulk and scRNA-Seq data from patients with AILD, assessing the correlation between macrophage and HSC1 fibrotic gene programs and their association with PSC. Based on the predicted CCCs, we extracted 2 gene signatures from our SRT data: one representing HSC1-derived fibrotic effector genes (COL1A1, COL3A1, COL4A1, MGP, MMP2, and VCAN) and another for macrophage-derived fibrotic driver genes (Supplemental Table 3). To assess the activity of these gene signatures, we defined the fibrotic effector score as the average expression of the fibrotic effector genes, and the fibrotic driver score as the weighted average expression of the fibrotic driver genes, using Spacia-derived β coefficients as weights. We first calculated these scores in a public bulk RNA-Seq dataset from adult patients with AILD (32). In this dataset, both the fibrotic driver and effector scores were significantly higher in patients with PSC compared with healthy controls (HCs) (driver score P = 0.014; effector score P = 0.033, Figure 6A). Similarly, in our in-house RNA-Seq data from pediatric patients with AILD (30 AIH, 34 PSC), both scores were elevated in patients with advanced fibrosis (driver score P = 0.031; effector score P < 0.001, Figure 6B).
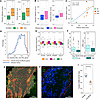 Figure 6
Orthogonal validation of effector and driver fibrotic signatures. (A) In silico validation of fibrotic driver and effector score in bulk liver RNA-Seq data from healthy controls (HCs) and adult patients with PSC. (B) Fibrotic driver and effector score in pediatric patients with PSC with early or advanced stages of fibrosis, which is defined as METAVIR ≥ 2 or Ishak ≥ 3. (C) Pearson’s correlation between fibrotic driver scores calculated in macrophages and fibrotic effector scores calculated in fibroblasts. (D) Comparison between baseline correlation between macrophage and fibroblast DEGs, and correlation between the fibrotic driver and effector scores. Blue line represents the distribution of the baseline correlation in 1,000 simulations using randomly sampled DEGs. Orange line represents the observed correlation between the fibrotic driver and effector scores, calculated in macrophages and fibroblasts, respectively. (E) Boxplot showing proteins that are elevated in PSC/AIH compared with HC in plasma. Statistical test was done using 1-way ANOVA. (F) Bile duct injury and liver stiffness measures in patients with AILD with high- or low- average plasma concentrations for fibrotic driver markers. Whiskers were extended to 1.5 times IQR from Q1 and Q3. (G) SHG image of a representative fibrotic area. Fibrotic regions were defined as SHG-positive and are highlighted. Scale bar: 100 μm. (H) Immunofluorescence image showing the distribution of CD68+/CD18+ macrophages. Double-positive macrophages are indicated by white arrows, and fibrotic regions are outlined in red. Scale bar: 100 μm. (I) Quantification of CD68+/CD18+ area in fibrotic and nonfibrotic regions. Statistical significance was determined by Student’s t test. *P < 0.05, ***P < 0.001.
Next, we leveraged a public scRNA-Seq dataset from healthy and PSC/PBC donors (10) to examine the correlation between the fibrotic driver and effector gene signatures. The driver and effector scores were calculated at the single-cell level in macrophage and fibroblast populations, respectively, and then aggregated at the patient level. We observed a strong correlation between these scores (Pearson’s correlation = 0.74, P = 0.022, Figure 6C). To ensure this correlation was not simply due to these genes being among the top expressed genes in macrophage and fibroblast populations, we conducted a control analysis using randomly sampled top DEGs specific to these cell types. Although macrophage- and fibroblast-specific DEG expression was moderately correlated at the patient level (average Pearson’s correlation = 0.374), the observed correlation between the fibrotic driver and effector signatures was significantly stronger than this baseline (empirical P = 0.021, Figure 6D). These findings suggest that the upregulation of macrophage fibrotic driver genes is specifically associated with increased expression of fibrotic genes in fibroblasts within the same patient.
To determine whether the macrophage fibrotic gene signature is also reflected at the protein level in plasma, we performed SomaScan-based proteomic profiling using plasma samples from HCs (n = 22), pediatric patients with AIH (n = 43), and patients with PSC (n = 43; Table 3). Eight out of 17 macrophage fibrotic drivers (LYZ, GRN, GPNMB, FCN1, CD163, CSF1R, IFNGR1, and CCL21) were included in the SomaScan panel. Among them, plasma concentrations for CD163, CSF1R, IFNGR1, and CCL21 were increased in patients with AILD compared with HCs (Figure 6E). Next, we calculated the fibrotic driver score based on the average expression of available proteins in the SomaScan panel. Patients were dichotomized based on this score, with those above the median assigned to the high group and those below to the low group. Clinical measures were compared between the 2 groups. Markers of hepatocellular injury (i.e., serum aspartate aminotransferase [AST] and alanine aminotransferase [ALT]) did not differ between the groups (data not shown). However, ALP levels — a biomarker of bile duct epithelial injury — were elevated in patients with higher fibrotic driver scores (ALP P = 0.025; Figure 6F). Out of the 108 plasma samples, 63.5% were collected with a median of 0.35 months before or after a research MR elastography examination. We had shown before that MR elastography–derived liver stiffness values predicted histological stage of fibrosis in pediatric AILD (33). In this study, patients with higher fibrotic driver scores exhibited significantly higher liver stiffness values by MR elastography (4.2 kPa vs. 3.1 kPa, P = 0.014, Figure 6F).
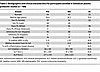 Table 3
Demographics and clinical characteristics for participants enrolled in SomaScan plasma proteomic studies (n = 108)
To further validate the putative role of macrophages as a local fibrotic driver predicted by our SRT analysis, we performed immunofluorescence and second harmonic generation (SHG) imaging on liver biopsies from 4 pediatric patients with PSC with established fibrosis, matching the samples used for scSRT. SHG was used to define collagen-rich fibrotic regions (Figure 6G), and immunofluorescence was used to identify CD68+/CD18+ macrophages (Figure 6H), with CD18 corresponding to ITGB2, one of the top macrophage fibrotic driver genes linked to HSC1 in our CCC analysis. Comparing the CD68+/CD18+ area between fibrotic and nonfibrotic regions within the same sections showed that CD68+/CD18+ macrophages were significantly enriched in fibrotic regions (66.3% vs. 33.4%, P = 0.012, Figure 6I). These data provide protein-level validation of the macrophage enrichment pattern identified by SRT in fibrotic PSC regions.


