
Research ArticleCell biologyNephrology
Open Access |  10.1172/jci.insight.198555
SMOC2 promotes partial epithelial-mesenchymal transition and maladaptive repair in renal tubular epithelial cells
Schrodinger Cenatus,1,2 Peng Gao,1,3 Nathalie Henley,1 Caroline Lamarche,1,4 Xue-Song Liu,5 Frédérick A. Mallette,1,2,4 Jonatan Barrera-Chimal,1 and Casimiro Gerarduzzi1,2,3,4
1Maisonneuve-Rosemont Hospital Research Centre, Montreal, Canada.
2Programmes de biologie moléculaire, Faculté de médecine,
3Département de Pharmacologie et Physiologie, and
4Département de Médecine, Faculté de Médecine, Université de Montréal, Succ. Centre-Ville, Montreal, Quebec, Canada.
5School of Life Science and Technology, ShanghaiTech University, Shanghai, China.
Address correspondence to: Casimiro Gerarduzzi, Division of Nephrology, Maisonneuve-Rosemont Hospital, CIUSSS de l’Est-de-l’Île-de-Montréal, 5345, boul. de l’Assomption, Montréal, Quebec, Canada, H1T 2M4. Phone: 514.252.3400 ext:2813; Email: casimiro.gerarduzzi@umontreal.ca.
Find articles by Cenatus, S. in: PubMed | Google Scholar
1Maisonneuve-Rosemont Hospital Research Centre, Montreal, Canada.
2Programmes de biologie moléculaire, Faculté de médecine,
3Département de Pharmacologie et Physiologie, and
4Département de Médecine, Faculté de Médecine, Université de Montréal, Succ. Centre-Ville, Montreal, Quebec, Canada.
5School of Life Science and Technology, ShanghaiTech University, Shanghai, China.
Address correspondence to: Casimiro Gerarduzzi, Division of Nephrology, Maisonneuve-Rosemont Hospital, CIUSSS de l’Est-de-l’Île-de-Montréal, 5345, boul. de l’Assomption, Montréal, Quebec, Canada, H1T 2M4. Phone: 514.252.3400 ext:2813; Email: casimiro.gerarduzzi@umontreal.ca.
Find articles by Gao, P. in: PubMed | Google Scholar
1Maisonneuve-Rosemont Hospital Research Centre, Montreal, Canada.
2Programmes de biologie moléculaire, Faculté de médecine,
3Département de Pharmacologie et Physiologie, and
4Département de Médecine, Faculté de Médecine, Université de Montréal, Succ. Centre-Ville, Montreal, Quebec, Canada.
5School of Life Science and Technology, ShanghaiTech University, Shanghai, China.
Address correspondence to: Casimiro Gerarduzzi, Division of Nephrology, Maisonneuve-Rosemont Hospital, CIUSSS de l’Est-de-l’Île-de-Montréal, 5345, boul. de l’Assomption, Montréal, Quebec, Canada, H1T 2M4. Phone: 514.252.3400 ext:2813; Email: casimiro.gerarduzzi@umontreal.ca.
Find articles by Henley, N. in: PubMed | Google Scholar
1Maisonneuve-Rosemont Hospital Research Centre, Montreal, Canada.
2Programmes de biologie moléculaire, Faculté de médecine,
3Département de Pharmacologie et Physiologie, and
4Département de Médecine, Faculté de Médecine, Université de Montréal, Succ. Centre-Ville, Montreal, Quebec, Canada.
5School of Life Science and Technology, ShanghaiTech University, Shanghai, China.
Address correspondence to: Casimiro Gerarduzzi, Division of Nephrology, Maisonneuve-Rosemont Hospital, CIUSSS de l’Est-de-l’Île-de-Montréal, 5345, boul. de l’Assomption, Montréal, Quebec, Canada, H1T 2M4. Phone: 514.252.3400 ext:2813; Email: casimiro.gerarduzzi@umontreal.ca.
Find articles by Lamarche, C. in: PubMed | Google Scholar
1Maisonneuve-Rosemont Hospital Research Centre, Montreal, Canada.
2Programmes de biologie moléculaire, Faculté de médecine,
3Département de Pharmacologie et Physiologie, and
4Département de Médecine, Faculté de Médecine, Université de Montréal, Succ. Centre-Ville, Montreal, Quebec, Canada.
5School of Life Science and Technology, ShanghaiTech University, Shanghai, China.
Address correspondence to: Casimiro Gerarduzzi, Division of Nephrology, Maisonneuve-Rosemont Hospital, CIUSSS de l’Est-de-l’Île-de-Montréal, 5345, boul. de l’Assomption, Montréal, Quebec, Canada, H1T 2M4. Phone: 514.252.3400 ext:2813; Email: casimiro.gerarduzzi@umontreal.ca.
Find articles by Liu, X. in: PubMed | Google Scholar
1Maisonneuve-Rosemont Hospital Research Centre, Montreal, Canada.
2Programmes de biologie moléculaire, Faculté de médecine,
3Département de Pharmacologie et Physiologie, and
4Département de Médecine, Faculté de Médecine, Université de Montréal, Succ. Centre-Ville, Montreal, Quebec, Canada.
5School of Life Science and Technology, ShanghaiTech University, Shanghai, China.
Address correspondence to: Casimiro Gerarduzzi, Division of Nephrology, Maisonneuve-Rosemont Hospital, CIUSSS de l’Est-de-l’Île-de-Montréal, 5345, boul. de l’Assomption, Montréal, Quebec, Canada, H1T 2M4. Phone: 514.252.3400 ext:2813; Email: casimiro.gerarduzzi@umontreal.ca.
Find articles by
Mallette, F.
in:
PubMed
|
Google Scholar
|

1Maisonneuve-Rosemont Hospital Research Centre, Montreal, Canada.
2Programmes de biologie moléculaire, Faculté de médecine,
3Département de Pharmacologie et Physiologie, and
4Département de Médecine, Faculté de Médecine, Université de Montréal, Succ. Centre-Ville, Montreal, Quebec, Canada.
5School of Life Science and Technology, ShanghaiTech University, Shanghai, China.
Address correspondence to: Casimiro Gerarduzzi, Division of Nephrology, Maisonneuve-Rosemont Hospital, CIUSSS de l’Est-de-l’Île-de-Montréal, 5345, boul. de l’Assomption, Montréal, Quebec, Canada, H1T 2M4. Phone: 514.252.3400 ext:2813; Email: casimiro.gerarduzzi@umontreal.ca.
Find articles by Barrera-Chimal, J. in: PubMed | Google Scholar
1Maisonneuve-Rosemont Hospital Research Centre, Montreal, Canada.
2Programmes de biologie moléculaire, Faculté de médecine,
3Département de Pharmacologie et Physiologie, and
4Département de Médecine, Faculté de Médecine, Université de Montréal, Succ. Centre-Ville, Montreal, Quebec, Canada.
5School of Life Science and Technology, ShanghaiTech University, Shanghai, China.
Address correspondence to: Casimiro Gerarduzzi, Division of Nephrology, Maisonneuve-Rosemont Hospital, CIUSSS de l’Est-de-l’Île-de-Montréal, 5345, boul. de l’Assomption, Montréal, Quebec, Canada, H1T 2M4. Phone: 514.252.3400 ext:2813; Email: casimiro.gerarduzzi@umontreal.ca.
Find articles by Gerarduzzi, C. in: PubMed | Google Scholar
Published August 12, 2026 - More info
JCI Insight. 2026;11(18):e198555. https://doi.org/10.1172/jci.insight.198555.
© 2026 Cenatus et al. This work is licensed under the Creative Commons Attribution 4.0 International License. To view a copy of this license, visit http://creativecommons.org/licenses/by/4.0/.
Received: August 11, 2025; Accepted: July 30, 2026


-
Results
Persistent Smoc2 expression during UUO aggravates maladaptive TEC repair and renal fibrosis. Transgenic mice overexpressing Smoc2 (Smoc2-tg), with a 2.5-fold increase in SMOC2 protein, are more prone to kidney injury and fibrosis (39). To investigate this in renal tubules, we examined RNA-seq data from Smoc2-tg and WT mice after 7 days of UUO. Compared with WT, Smoc2-tg mice showed decreased expression of kidney transporter genes, including solute carriers (SLC), aquaporins, and ATPases (Figure 1A). Some transporters were also increased in Smoc2-tg mice (Supplemental Figure 1A; supplemental material available online with this article; https://doi.org/10.1172/jci.insight.198555DS1). Notably, Slc52a2 and Slc1a5 — upregulated in cancers and pulmonary fibrosis, respectively — were among the most upregulated (40, 41). Additionally, Smoc2-tg mice showed increased Foxk1 expression (Figure 1B), which has a profibrotic role in proximal tubules after injury (42, 43). They also showed more kidney injury and fibrosis, with higher Havcr1 (KIM-1) and Tgfb1 levels (Figure 1, C and D). Gene ontology molecular function (GO:MF) analysis of differentially expressed genes (DEGs) revealed affected functions, including kinase binding, DNA binding, transcription regulation, ECM, and integrin binding (Figure 2A). Gene set enrichment analysis showed that TGF-β signaling was negatively enriched in WT mice compared with Smoc2-tg mice (Figure 2B). WT mice undergoing UUO also showed negative enrichment for the mitotic spindle and G2/M checkpoint compared with Smoc2-tg mice (Figure 2, C and D), suggesting increased cell accumulation in the G2/M phase after injury.
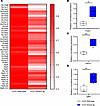 Figure 1
Smoc2-transgenic mice exhibit maladaptive tubular epithelial cell dedifferentiation and exacerbated kidney injury after UUO. (A) Heatmap displaying the relative expression of kidney epithelial transporter genes in Smoc2-transgenic (Smoc2-tg) mice compared with WT littermates 7 days after UUO. (B–D) Box plots showing the relative expression of the transcription factor Foxk1 (B), the proximal kidney injury gene Havcr1 (C), and the fibrotic gene Tgfb1 in Smoc2-tg and WT mice after UUO (D). Data are presented as mean ± SD, and adjusted P values (FDR) are shown on box plots; n = 4, **P < 0.01, ***P < 0.001
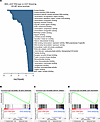 Figure 2
Smoc2-transgenic mice dysregulated pathways involved in pEMT after kidney injury. (A) Bar plots showing the gene ontology molecular function (GO:MF) analysis of the differentially expressed genes (DEGs) in Smoc2-tg mice compared with WT mice after UUO. (B–D) Gene set enrichment analyses showing decreased TGF-β signaling (B), mitotic spindle (C), and G2M checkpoint (D) in WT mice compared with Smoc2-tg mice after UUO.
SMOC2 expression and localization are associated with tubular injury, pEMT, and fibrosis in UUO, ischemia-reperfusion injury, and folic acid nephropathy. Loss of kidney transporters, inflammation, and fibrosis are linked to pEMT in CKD models (13, 16). The forkhead box protein K1 (FOXK1) regulates pEMT in tubular cells after injury (43). Additional analyses revealed that Smoc2-tg mice upregulate mesenchymal and fibrotic genes such as Tnc, Snai1, Col1a1, and Mmp3 (Supplemental Figure 1B). We therefore examined SMOC2 in relation to pEMT and fibrosis in UUO, folic acid nephropathy, and ischemia-reperfusion injury (Figure 3A). Male C57BL/6J mice showed increased Smoc2 after UUO, folic acid (FA), or ischemia-reperfusion (IR), along with higher Snai1, Twist1, and Tgfb1 (Figure 3, B–D). Increased SMOC2, fibronectin, collagen I, vimentin, and the TEC injury marker CK-18 were confirmed in injured tissues (Figure 3, E and F). Although Snai1 expression is mainly associated with tubules (13, 16, 44), genes such as Twist1 (45, 46), Tgfb1 (39), and Smoc2 (38, 39) are also expressed in fibroblasts, contributing to their activation and inflammation. We isolated tubules in the UUO model to assess their contribution to these genes (Figure 4, A and B). Tubules are enriched for Vil1 and Cdh16 relative to Col1a1, confirming successful isolation (Figure 4C). Tubules from injured kidneys showed increased Smoc2, Snai1, and Tgfb1, with no significant difference compared with interstitial cells, while Twist1 levels remained unchanged (Figure 4D). Considering RNA turnover after kidney injury is dynamic (47), and TWIST1 can be stabilized posttranslationally (47, 48), we assessed TWIST1 and FOXK1 protein levels in isolated tubules (Figure 4, E and F). Both proteins increased in injured tubules (Figure 4, E and F), confirming TECs as major contributors to the induction of Smoc2, mesenchymal, and profibrotic genes following injury.
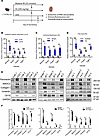 Figure 3
SMOC2 upregulation is concomitant with pEMT, injury, and fibrotic markers in obstructive, ischemic, and toxicant models of kidney injury. (A) Diagram depicting the study design for the murine kidney injury models. Male C57BL/6J mice were subjected to bilateral ischemia-reperfusion injury for 25 minutes, folic acid injection (250 mg/kg), or UUO. Mice were euthanized after 8 days for UUO and after 7 days for the other models before tissue collection and paraffin embedding. (B–D) Box plots showing the gene expression by qPCR of Smoc2, the pEMT transcription factors Snai1 and Twist1, and the fibrotic gene Tgfb1 in UUO, folic acid (FA) nephropathy, and ischemia-reperfusion (IR) injury, respectively. The expression of each gene was normalized by the expression of the housekeeping gene Gapdh. Data are presented as mean ± SD. (E) Western blots showing the levels of SMOC2, fibrotic proteins (fibronectin and collagen I), pEMT, and injury proteins (vimentin and CK-18, respectively) in all 3 models of kidney injury. (F) Violin plots showing the quantification of the Western blots in E. CoK, Contralateral kidney. Unpaired 2-tailed Student’s t test with Welch’s correction. *P < 0.05, **P < 0.01, ***P < 0.001; n = 4–6 for each model.
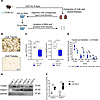 Figure 4
Injured tubules after UUO undergo pEMT and significantly contribute to Smoc2 upregulation. (A) Diagram depicting the study design for the isolation of kidney tubules by size exclusion before qPCR and Western blot analyses. (B) Microscopic images of the isolated tubules from contralateral (CoK) and UUO kidneys after 8 days of injury. Images were taken using a 10× objective. (C) Box plots showing the enrichment for the ratio of epithelial genes (Vil1 and chd16) over collagen I (Col1a1) for the tubules (Tub) and the interstitium (Int) following the extraction of tubules. Gene expression was measured by qPCR, and statistical tests were performed after log transformation. (D) Box plots showing the gene expression by qPCR of Smoc2, the pEMT transcription factors Snai1 and Twist1, and the fibrotic gene Tgfb1 in tubules (Tub) and interstitium (Int) from contralateral and UUO kidneys. The expression of each gene was normalized by the expression of the housekeeping gene Gapdh. Data are presented as mean ± SD. (E) Western blots showing the protein levels of pEMT transcription factors TWIST1 and FOXK1 in tubules from contralateral and UUO kidneys. (F) Violin plots showing the quantification of the Western blots in E. Unpaired 2-tailed Student’s t test with Welch’s correction (C and F), 1-way ANOVA (D). *P < 0.05, **P < 0.01; n = 3–4.
Previously, SMOC2 was found to localize primarily to the basement membrane of proximal and distal tubules (39). To determine whether SMOC2 localization is associated with TECs undergoing pEMT after injury, we first performed H&E staining to confirm injury in the mouse models (Figure 5A). We observed loss of brush borders and dilated tubules in the FA and UUO injury models, with less damage in the ischemia-reperfusion model, suggesting recovery in the latter (Figure 5A). We then performed immunofluorescence staining for SMOC2 and the proximal tubule injury marker KIM-1 in the UUO, FA, and IR models (Figure 5B). In all 3 models, both SMOC2 and KIM-1 were markedly increased in injured mice, with SMOC2 localized to the basement membrane of the kidney tubules and KIM-1 exhibiting an apical distribution (Figure 5B). Notably, several kidney tubules were double-positive for SMOC2 and KIM-1 (Figure 5B), particularly in the FA and IR models.
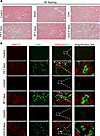 Figure 5
SMOC2 is localized at the tubular epithelium basement membrane and colocalized with tubular injury marker in different kidney regions. (A) H&E staining depicting the morphological structures of control and injured kidneys in folic acid (FA), ischemia-reperfusion (IR), and UUO models of kidney injury after 7 or 8 days. (B) Immunofluorescence showing the localization of SMOC2 and KIM-1 in folic acid (FA), ischemia-reperfusion (IR), and UUO models of kidney injury after 7 or 8 days. The arrows point to tubules positive for SMOC2 and KIM-1, while the dashed boxes indicate the magnified regions. The total original magnification is ×100; scale bar for HE staining: 100 μm; scale bar for immunofluorescence: 50 μm.
We then performed immunofluorescence for SMOC2 and the mesenchymal marker vimentin in patients with CKD and mouse kidney injury models. Kidneys of patients with CKD (IFTA scores 1 and 3) showed increased vimentin and SMOC2 levels compared with healthy kidneys, with SMOC2 localized in vimentin-expressing tubules, linking it to pEMT in CKD (Figure 6A and Supplemental Figure 2A). In all murine models, SMOC2 and vimentin increased after injury (Figure 6B). Vimentin was present in glomeruli in healthy and injured kidneys, with more interstitial expression after injury (Figure 6B). In the FA and UUO models, few tubules were positive for both markers, but ischemia-reperfusion showed more pronounced tubular staining for vimentin and SMOC2, indicating model-specific differences (Figure 6B). Immunofluorescence after 2 days of UUO confirmed similar patterns, with high expression in the glomeruli and interstitium but minimal in the tubules (Supplemental Figure 2B). Therefore, tubular vimentin expression showed a model-specific distribution rather than a temporal regulation. These results revealed that SMOC2 localization correlates with persistent tubular injury and pEMT, and that vimentin distribution varies by injury type.
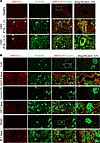 Figure 6
SMOC2 localization is associated with tubular cells undergoing pEMT in patients with CKD and murine models of kidney injury. (A) Immunofluorescence showing the localization of SMOC2 and vimentin in patients with CKD with a score of 1 or 3 for interstitial fibrosis and tubular atrophy (IFTA). (B) Immunofluorescence showing the localization of SMOC2 and vimentin in folic acid (FA), ischemia-reperfusion (IR), and UUO models of kidney injury after 7 or 8 days. The arrows point to tubules positive for SMOC2 and vimentin, while the dashed boxes indicate the magnified regions. Images were taken using a 10× objective. The total original magnification is ×100; scale bar for A: 50 μm; scale bar for B: 100 μm.
SMOC2 induces pEMT properties in proximal TECs. Our findings in mouse tissues and patients with CKD linking SMOC2 to pEMT prompted us to test if SMOC2 induces pEMT in TECs. We stimulated HK-2 cells with recombinant human SMOC2 (rhSMOC2) at levels similar to those in the serum of patients with CKD (37). After stimulation, HK-2 cells showed an early decrease in E-cadherin and a gradual increase in fibronectin, N-cadherin, and vimentin (Figure 7, A and B), confirming pEMT as a dynamic process (43). SMOC2 modulates mesenchymal markers over time, with sustained vimentin and reduced N-cadherin during pEMT development (Supplemental Figure 3, A–E). Stimulated cells also exhibited lower AQP1, a proximal tubule water transporter (Figure 7, A and B). To observe morphological changes, we performed phalloidin staining, using recombinant human TGF-β1 (rhTGF-β1) as a positive control. After 48 hours, rhTGF-β1–treated HK-2 cells exhibited pEMT features, including increased actin filament formation and an elongated shape. Similarly, rhSMOC2-treated cells appeared enlarged with actin reorganized into stress fibers (Figure 7, C and D). We also evaluated chemotaxis and migration of rhSMOC2-stimulated HK-2 cells using transwell and scratch assays, respectively (Figure 8, A–D). Both confirmed that SMOC2 enhances TEC motility (Figure 8, A–D).
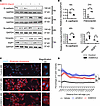 Figure 7
Recombinant SMOC2 stimulates the pEMT properties of proximal tubular epithelial cells. (A) Western blots showing the protein levels of E-cadherin, fibronectin, N-cadherin, vimentin, and aquaporin 1 (AQP1) in HK-2 cells stimulated with a recombinant human SMOC2 (rhSMOC2) protein at different timepoints. (B) Violin plots showing the quantification of the Western blots in A. (C) Phalloidin staining depicting the morphology and actin filament structures of HK-2 cells stimulated with rhSMOC2 or recombinant human TGF-β1 (rhTGF-β1) for 48 hours. The dashed boxes represent the magnified areas. Images were taken using a 10× objective. The total original magnification is ×100; scale bar for C: 100 μm. (D) Graph showing the actin distribution in control, rhSMOC2- or rhTGF-β1–treated HK-2 cells starting from a cell edge. Unpaired 2-tailed Student’s t test with Welch’s correction (B), 2-way ANOVA (D). ***P < 0.001 for interaction, ###P < 0.001 for column factor; n = 10 per condition. For Western blot analyses, *P < 0.05, **P < 0.01; n = 3 per condition.
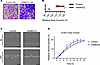 Figure 8
Recombinant SMOC2 increases the motility of proximal tubular epithelial cells. (A and B) Transwell assay and the corresponding quantification showing the chemotaxis of HK-2 cells stimulated with rhSMOC2 after 24 hours compared with nonstimulated (control) cells. The total original magnification for A and C is ×100; scale bar for C: 400 μm. (C) Scratch assay indicating the migration of HK-2 cells stimulated with rhSMOC2 after 24 hours compared with control cells. (D) Analysis of the scratch assay in C showing the relative wound density of rhSMOC2-stimulated HK-2 cells compared with the corresponding controls. Unpaired 2-tailed Student’s t test with Welch’s correction. *P < 0.05, **P < 0.01; n = 3 for each experiment.
We next explored whether ectopic expression of SMOC2 in HK-2 cells would exert the same effects. Similar to rhSMOC2 treatment, ectopic expression of a vector encoding the full-length SMOC2 with a Myc tag (vSMOC2-Myc) decreased the protein levels of E-cadherin and increased fibronectin, N-cadherin, and vimentin when compared with the control vector (vEmpty-Myc) (Figure 9, A and B). Compared with the control HK-2 cells, which exhibit a round shape and actin filaments lining beneath the cell cortex, HK-2 cells ectopically expressing the full-length SMOC2 are enlarged and display actin filaments rearranged into stress fibers (Figure 9, C and D). Similar to rhSMOC2 treatment, stable overexpression of SMOC2 via lentiviral transduction increased chemotaxis and migration of HK-2 cells (Figure 10, A–D).
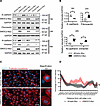 Figure 9
Ectopic expression of SMOC2 induces the pEMT properties of proximal tubular epithelial cells. (A) Western blots showing the protein levels of E-cadherin, fibronectin, N-cadherin, and vimentin in HK-2 cells ectopically expressing a SMOC2-Myc vector (vSMOC2-Myc) or the corresponding control vector with only the Myc-tag (vEmpty-Myc) at different time points. (B) Violin plots showing the quantification of the Western blots in A. (C) Phalloidin staining indicating the morphology and actin filament structures of HK-2 cells ectopically expressing vSMOC2-Myc or vEmpty-Myc for 48 hours. The dashed boxes represent the magnified regions. Images were taken using a 10× objective. The total original magnification is ×100; scale bar: 50 μm. (D) Graph showing the actin distribution in HK-2 cells ectopically expressing a Myc-tag (vEmpty-Myc) or a SMOC2-Myc (vSMOC2-Myc) vector. Unpaired 2-tailed Student’s t test with Welch’s correction (B), 2-way ANOVA (D). *P < 0.05 for interaction, ###P < 0.001 for column factor; n = 10 per condition. For Western blot analyses, *P < 0.05, **P < 0.01; n = 3 per condition.
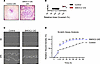 Figure 10
Ectopic expression of SMOC2 increases the motility of proximal tubular epithelial cells. (A and B) Transwell assay and the corresponding quantification (B) showing the chemotaxis of HK-2 cells transduced with a lentiviral vector containing SMOC2 (SMOC2 O/E) or a control lentiviral vector for 24 hours. (C) Scratch assay indicating the migration of transduced HK-2 cells ectopically expressing SMOC2 or the control lentiviral vector for 48 hours. Total magnification ×40 for A and ×100 for C. Scale bar for C: 400 μm. (D) Analysis of the scratch assay in C showing the relative wound density of HK-2 cells overexpressing SMOC2 compared with the cells expressing the control lentiviral vector. Unpaired 2-tailed Student’s t test with Welch’s correction. *P < 0.05, **P < 0.01; n = 3 per condition.
SMOC2 achieves ECM binding and affects TECs through its calcium-binding domain. SMOC2 is a modular protein with 5 domains of unknown function in kidney TECs.
To identify which domain mediates effects in HK-2 cells, we used mutants lacking the extracellular calcium-binding domain (vΔEC, where v indicates vector and Δ indicates deletion), follistatin domain (vΔFS), or containing only the calcium-binding domain (vEC) (Figure 11A). The vEC and vΔFS mutants increased fibronectin, vimentin, and N-cadherin levels similarly to full-length SMOC2 in HK-2 cells; vΔEC had no effect (Figure 11, B and C). We then collected the media and the ECM from transfected cells to analyze the localization of each mutant, using 10% and 7.5% gels to detect small proteins and separate larger proteins from albumin. The analysis revealed that the ΔEC mutant was abundant in the media but low in the ECM, indicating the EC domain is necessary for matrix binding (Figure 11, B and D). The full-length protein and EC domain were mainly in the matrix, whereas ΔFS was in both the media and the matrix (Figure 11, B and D). Intriguingly, the actin cytoskeleton was affected by all constructs (Figure 12, A and B). The EC domain significantly enhanced chemotaxis in HK-2 cells, unlike the other mutants (Figure 12, C and D).
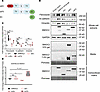 Figure 11
The extracellular calcium-binding domain of SMOC2 mediates its binding to the ECM to trigger the mesenchymal properties of tubular epithelial cells. (A) Schematic representation of the vector constructs used in the study. FS, follistatin-like domain; TY, thyroglobulin type I domains; S, SMOC-specific domain; EC, extracellular calcium-binding domain. (B) Western blots showing the protein levels of fibronectin, N-cadherin, vimentin, and SMOC2 in HK-2 cells ectopically expressing a control vector (Empty vector), full-length SMOC2, or different SMOC2 truncated mutants for 48 hours. The level of full-length SMOC2 and truncated mutants was measured in whole-cell extracts, the cells’ media, and the extracellular matrix. (C) Violin plots showing the quantification of the mesenchymal markers from whole-cell lysates in B. (D) Violin plots showing the quantification of the levels of SMOC2 and each truncated mutant in the ECM produced by the transfected HK-2 cells in B. One-way ANOVA was used for statistical analyses. *P < 0.05, **P < 0.01, ***P < 0.001; n = 3 per condition.
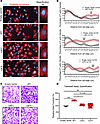 Figure 12
The extracellular calcium binding and the follistatin domains of SMOC2 contribute to cytoskeletal rearrangement and migration of tubular epithelial cells. (A) Phalloidin staining showing the morphology and actin filament structures of HK-2 cells ectopically expressing a control vector or different SMOC2 truncated mutants for 48 hours. The dashed boxes represent the magnified regions. Images were taken using a 10× objective. (B) Graphs showing the actin distribution in HK-2 cells expressing different SMOC2 truncated mutants compared with HK-2 cells expressing a control vector. A 2-way ANOVA was used for statistical analyses. **P < 0.01, ***P < 0.001 for interaction, ###P < 0.001 for column factor; n = 10 per condition. (C) Transwell assay showing the chemotaxis of HK-2 cells ectopically expressing a control vector or different SMOC2 truncated mutants for 24 hours. (D) Violin plots showing the quantification of the transwell assay in C. One-way ANOVA; *P < 0.05, ***P < 0.001, ns: not significant; n = 3 per condition. 25. The total original magnification for A and C is ×100; scale bar for A: 50 μm.
SMOC2 promotes the activation of pEMT transcription factors. Partial EMT is regulated by critical transcription factors, with SNAI1 and TWIST1 being the most studied (13, 16, 25, 26, 44, 48). To investigate SMOC2’s effect on pEMT transcription factors, we performed qPCR for SNAI1 and TWIST1 in HK-2 cells stimulated by rhSMOC2 or transfected to overexpress SMOC2. The expression of both was unaffected by SMOC2 (Supplemental Figure 3F). We then analyzed the levels and localization of pEMT transcription factors using immunofluorescence for TWIST1 and FOXK1. After rhSMOC2 treatment, HK-2 cells showed mild upregulation of TWIST1 but strong nuclear localization compared with controls (Figure 13A). FOXK1 was upregulated and localized to the nucleus, similar to the effects of rhTGF-β1 (Figure 13, B–D). These findings suggest that SMOC2 activates pEMT transcription factors without increasing their gene expression.
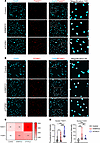 Figure 13
SMOC2 promotes the activation of pEMT transcription factors. (A and B) Immunofluorescence staining showing the expression and localization of TWIST1 (A) and FOXK1 (B) in unstimulated cells (control) and cells stimulated with rhSMOC2 or rhTGF-β1 for 48 hours. The dashed boxes represent the magnified areas. Images were taken using a 20× objective. (C) Heatmap showing the total level of TWIST1 and FOXK1 in control, rhSMOC2- or rhTGF-β1–treated cells. (D) Violin plots showing the nuclear signal for TWIST1 and FOXK1 in control, rhSMOC2- or rhTGF-β1–treated cells. One-way ANOVA; *P < 0.05, **P < 0.01 ***P < 0.001; n = 15–34. The total original magnification is ×100; scale bar for A and B: 50 μm.
SMOC2 stimulates the mesenchymal properties of TECs through integrin signaling. SMOC2 was previously found to interact with integrin β1 in muscle stem cells, keratinocytes, and kidney fibroblasts (39, 49, 50). In clear cell renal cell carcinoma (ccRCC) cells, SMOC2 also activates key components of the integrin signaling pathway, including focal adhesion kinase (FAK) and paxillin (33). To investigate whether SMOC2 activates integrin signaling in TECs, we stimulated HK-2 cells with rhSMOC2 for 10 minutes. SMOC2 increased FAK autophosphorylation on tyrosine 397 and downstream phosphorylation of paxillin on tyrosine 118 (Figure 14, A and B). We then inhibited FAK with a small-molecule inhibitor (FAKi). A concentration gradient showed that 10 μM and 12.5 μM effectively prevented phosphorylation of FAK and paxillin after 48 hours (Figure 14, C and D). We used 10 μM for subsequent experiments due to minimal toxicity. Preincubating HK-2 with 10 μM FAKi abrogated the upregulation of fibronectin, N-cadherin, and vimentin levels by rhSMOC2 (Figure 14, E and F). Since TGF-β1 is a key profibrotic factor, we tested if SMOC2 influences its pathway. While SMOC2 regulates TGF-β1 signaling via SMADs in pulmonary fibrosis (36), our results show it does not affect SMAD phosphorylation in tubular cells (Supplemental Figure 4, A and B). Cotreatment with SMOC2 and TGF-β1 further increased mesenchymal markers compared with TGF-β1 alone, indicating an additive effect in promoting pEMT (Supplemental Figure 4, C and D).
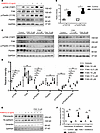 Figure 14
SMOC2 activates integrin signaling to stimulate the pEMT properties of tubular epithelial cells. (A) Western blots showing the protein levels of phosphorylated FAK (pFAK), phosphorylated paxillin (pPaxillin), and their total levels in rhSMOC2-treated HK-2 cells after 10 minutes. (B) Quantification of the Western blots in A. (C) Western blots showing pFAK, pPaxillin levels, and their total levels in HK-2 cells treated with a gradient of FAK inhibitor (FAKi) for 48 hours. (D) Quantification of the Western blots in C. (E) Western blots indicating the levels of mesenchymal markers fibronectin, N-cadherin, and vimentin in HK-2 cells stimulated with rhSMOC2 with or without FAKi treatment. (F) Quantification of the Western blots in E. Unpaired 2-tailed Student’s t test with Welch’s correction (B), 1-way ANOVA (D and F). *P < 0.05, **P < 0.01, ***P < 0.001; n = 3 for each experiment.
Integrins β1 and β3 are important receptors for SMOC2 in TECs. To further investigate the integrins involved in FAK activation after rhSMOC2 treatment, we first examined their expression in HK-2 cells and found that they expressed several α and β integrins at both protein and mRNA levels (Figure 15A and Supplemental Figure 5A). Analysis of existing single-cell RNA-seq data shows that integrins β1 and β3 were upregulated in TECs in UUO and ischemia-reperfusion (Figure 15B and Supplemental Figure 5, B–E) (17, 51). Integrin β3 is notably upregulated in failed-repair proximal tubular cells during chronic ischemia-reperfusion, suggesting a role in maladaptive repair (Figure 15B). To test if SMOC2 interacts with these integrins, we performed immunoprecipitation in HK-2 cells expressing SMOC2-Myc. Using Myc beads, we found that SMOC2 interacts with integrins β1 and β3 (Figure 15C). We then studied these integrins’ roles in mesenchymal marker induction by rhSMOC2. Silencing integrin β3 with siRNA prevented fibronectin upregulation after rhSMOC2, with no effect on vimentin (Figure 15, D and E). Silencing integrin β1 did not affect fibronectin but affected vimentin (Figure 15, F and G). Both integrins modestly affected N-cadherin (Figure 15, D–H). To explore their signaling, we silenced integrins β1 and β3 24 hours before stimulating HK-2 cells with rhSMOC2 for 30 minutes. Silencing integrin β3 decreased phosphorylation of FAK and paxillin; integrin β1 silencing had a modest effect (Supplemental Figure 6, A and B). We then used Cilengitide, which has higher affinity for integrin β3 and affects integrin β1 at higher doses (52, 53). At low doses (1–15 nM), cilengitide modestly reduced FAK phosphorylation after rhSMOC2, suggesting β3-mediated FAK phosphorylation (Supplemental Figure 6, C and D). These findings show that integrins β1 and β3 are SMOC2 receptors in TECs and cooperate to induce mesenchymal markers, mainly via β3.
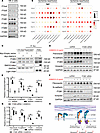 Figure 15
Integrins β1 and β3 are important ECM receptors mediating the effects of SMOC2 in tubular epithelial cells. (A) Western blots showing the expression of several integrins in HK-2 cells under normal conditions. (B) Single-cell RNA-seq data showing the gene expression of integrins β1 (Itgb1) and β3 (Itgb3) in proximal tubular cells (PTC) after ischemia-reperfusion injury. These images were generated by the Software from the Kidney Interactive Transcriptomics. (C) Immunoprecipitation indicating the binding of SMOC2 to integrins β1 and β3 in HK-2 cells. (D and F) Western blots showing the expression of mesenchymal markers in HK-2 cells transfected with a scrambled siRNA (ssiRNA), or a siRNA targeting integrin β3 (ITGB3 siRNA) (D) or integrin β1 (ITGB1 siRNA) (F). The transfected cells were stimulated with rhSMOC2 or left nonstimulated for 48 hours. (E and G) Quantification of the Western blots in (D and F), respectively. (H) Schematic representation of the mechanism for SMOC2-regulated mesenchymal proteins in tubular epithelial cells. One-way ANOVA; *P < 0.05, **P < 0.01; n = 3 for each experiment.
SMOC2 regulates integrin signaling and pEMT in injured kidneys following UUO. Our in vivo findings linking SMOC2 expression and pEMT, along with in vitro pathway insights, led us to hypothesize that SMOC2 regulates pEMT in injured kidneys. To evaluate this, we isolated tubules from WT and Smoc2-KO mice after UUO (Figure 16A). qPCR showed that tubules are enriched for Vil1 and Cdh16 relative to Col1a1, confirming successful isolation (Figure 16, B and C). Genotyping confirmed the absence of Smoc2, and qPCR showed unchanged Smoc2 expression in KO tubules after UUO (Figure 16, D and E). Tubule morphology was not different between WT and Smoc2-KO mice (Figure 16F). Western blots indicated decreased phosphorylation of FAK and paxillin in injured kidneys of Smoc2-KO mice versus WT littermates (Figure 16, G and H). Total FAK increased in injured kidneys and decreased in KO mice compared with WT, while paxillin was unchanged (Figure 16, G and H). Partial EMT markers fibronectin and α-SMA decreased in injured KO mice compared with WT, linking integrin signaling to pEMT (Figure 16, G and H).
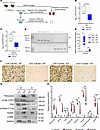 Figure 16
SMOC2 regulates integrin signaling and pEMT in mice undergoing UUO. (A) Diagram depicting the study design for the analyses of tubules after UUO. Male C57BL/6J mice, WT and Smoc2-KO, were subjected to UUO for 8 days. Tubules were isolated from control and injured kidneys for qPCR and Western blot analyses. (B and C) Box plots showing the enrichment for the ratio of epithelial genes Vil1 (B) and chd16 (C) over collagen I (Col1a1) for the tubules (Tub) and the interstitium (Int) following the extraction of tubules. Gene expression was measured by qPCR, and statistical tests were performed after log transformation. (D) Genotyping confirming the presence of the Smoc2 gene in WT mice (300 pb) and the disrupted gene in Smoc2-KO mice (900 pb). (E) Box plots showing the gene expression of Smoc2 measured by qPCR in contralateral and UUO tubules from WT and Smoc2-KO mice. Data are presented as mean ± SD. (F) Microscopic images of tubules isolated from contralateral and UUO kidneys from WT and Smoc2-KO mice. Images were taken using a 10× objective. (G) Western blots showing the total levels of FAK and paxillin, and the levels of autophosphorylated FAK (p-FAK, Y397), phosphorylated paxillin (p-paxillin, Y118), fibronectin, and α-SMA from contralateral and UUO tubules of WT and Smoc2-KO mice. (H) Violin plots showing the quantification of the Western blots in G. Unpaired 2-tailed Student’s t test with Welch’s correction (B and C), 1-way ANOVA (E and H). *P < 0.05, **P < 0.01, ***P < 0.001; n = 4 per condition. Scale bar: 800 μm.
Kidney TECs stimulated by rhSMOC2 crosstalk with fibroblasts to promote fibrosis. Previous studies on genetic mouse models where pEMT is prevented show less fibroblast activation and fibrosis after kidney injury (13, 16). We assessed fibrosis in our kidney injury models with Picrosirius red (PSR) staining, detecting positive staining in FA and IR models after 7 days and in the UUO model after 8 days, confirming fibrosis (Figure 17A). Earlier research indicates SMOC2 interacts with fibroblasts to promote activation (38, 39). Our immunofluorescence for SMOC2 and α-SMA showed 2 patterns: in the cortex, SMOC2 localized to the tubular basement membrane without overlapping α-SMA, while in the medulla, SMOC2 partly overlapped with α-SMA, indicating interaction with fibroblasts (Figure 17B). We then hypothesized that SMOC2 activates fibroblasts paracrinely, based on prior pEMT findings suggesting crosstalk between TECs and fibroblasts to promote fibrosis (13, 16). Using conditioned media from rhSMOC2-stimulated HK-2 cells, we stimulated NRK-49F cells (Figure 17C). After 24 hours, fibroblasts showed increased levels of fibronectin and α-SMA, early activation markers, in rhSMOC2-stimulated conditioned media (Figure 17, D and E). At 48 hours, periostin was elevated, but collagen I was unchanged (Figure 17, D and E). Since TGF-β1 is essential for collagen I production (54), we evaluated activated TGF-β1 levels, which remained unchanged, explaining the lack of collagen I (Figure 17, D and E). These findings reveal that rhSMOC2-stimulated TECs undergoing pEMT activate nearby fibroblasts via paracrine signaling.
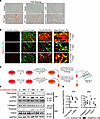 Figure 17
SMOC2 promotes an epithelial-fibroblast crosstalk during fibrogenesis. (A) Picrosirius red (PSR) staining depicting the burden of fibrosis after 7 days of folic acid (FA), ischemia-reperfusion (IR), and 8 days of UUO in mice kidneys. (B) Immunofluorescence indicating the localization of SMOC2 and the myofibroblast marker α-SMA in the cortex and medulla of injured mice in all 3 models of kidney injury. The arrows indicate kidney regions where SMOC2 and α-SMA are colocalized; the dashed boxes indicate the magnified areas. Images were taken using a 10× objective. (C) Diagram depicting the experimental design of the conditioned media treatment. HK-2 cells were stimulated with rhSMOC2 or vehicle-treated for 48 hours. The secreted factors were enriched for 24 hours, and NRK-49F cells were treated with the conditioned media for 24 and 48 hours. (D) Western blots showing the protein levels of fibronectin, α-SMA, collagen I, periostin, and the activated form of TGF-β1 in NRK-49F stimulated with conditioned media from vehicle-treated (C for control) or rhSMOC2-treated (SM for SMOC2) HK-2 cells for the indicated times. (E) Quantification of the Western blots in D for NRK-49F cells stimulated with the conditioned media (CM) from rhSMOC2-treated or control HK-2 cells. Unpaired 2-tailed Student’s t test with Welch’s correction. *P < 0.05, **P < 0.01; n = 3 per condition. The total original magnification is ×100; scale bar for A: 100 µm; scale bar for B: 50 μm.


