
Research ArticleCardiologyVascular biology
Open Access |  10.1172/jci.insight.202798
Mild caloric restriction accelerates atherosclerosis via dysregulated cholesterol homeostasis and lipogenesis in HCHF-fed ApoE-deficient mice
Yun Zhu,1 Yanzhe Xu,1 Gerhard Liebisch,2 and Juergen Borlak1
1Centre for Pharmacology and Toxicology, Hannover Medical School, Germany.
2Institute for Clinical Chemistry and Laboratory Medicine, University of Regensburg, Regensburg, Germany.
Address for correspondence. Jürgen Borlak, Centre for Pharmacology and Toxicology, Hannover Medical School, Carl-Neuberg-Str. 1, 30625 Hannover, Germany. Phone: 49.511.532.7250; Email: Borlak.Juergen@mh-hannover.de.
Authorship note: YZ and YX contributed equally to this work.
Find articles by Zhu, Y. in: PubMed | Google Scholar
1Centre for Pharmacology and Toxicology, Hannover Medical School, Germany.
2Institute for Clinical Chemistry and Laboratory Medicine, University of Regensburg, Regensburg, Germany.
Address for correspondence. Jürgen Borlak, Centre for Pharmacology and Toxicology, Hannover Medical School, Carl-Neuberg-Str. 1, 30625 Hannover, Germany. Phone: 49.511.532.7250; Email: Borlak.Juergen@mh-hannover.de.
Authorship note: YZ and YX contributed equally to this work.
Find articles by Xu, Y. in: PubMed | Google Scholar
1Centre for Pharmacology and Toxicology, Hannover Medical School, Germany.
2Institute for Clinical Chemistry and Laboratory Medicine, University of Regensburg, Regensburg, Germany.
Address for correspondence. Jürgen Borlak, Centre for Pharmacology and Toxicology, Hannover Medical School, Carl-Neuberg-Str. 1, 30625 Hannover, Germany. Phone: 49.511.532.7250; Email: Borlak.Juergen@mh-hannover.de.
Authorship note: YZ and YX contributed equally to this work.
Find articles by
Liebisch, G.
in:
PubMed
|
Google Scholar
|

1Centre for Pharmacology and Toxicology, Hannover Medical School, Germany.
2Institute for Clinical Chemistry and Laboratory Medicine, University of Regensburg, Regensburg, Germany.
Address for correspondence. Jürgen Borlak, Centre for Pharmacology and Toxicology, Hannover Medical School, Carl-Neuberg-Str. 1, 30625 Hannover, Germany. Phone: 49.511.532.7250; Email: Borlak.Juergen@mh-hannover.de.
Authorship note: YZ and YX contributed equally to this work.
Find articles by Borlak, J. in: PubMed | Google Scholar
Published September 28, 2026 - More info
JCI Insight. 2026;11(21):e202798. https://doi.org/10.1172/jci.insight.202798.
© 2026 Zhu et al. This work is licensed under the Creative Commons Attribution 4.0 International License. To view a copy of this license, visit http://creativecommons.org/licenses/by/4.0/.
Received: November 24, 2025; Accepted: September 14, 2026


-
Results
Experimental design and body weight outcomes. The experimental design is summarized in Supplemental Figure 1, and changes in body weight are shown in Figure 1A (supplemental material available online with this article; https://doi.org/10.1172/jci.insight.202798DS1). After 6 months, ApoE-deficient mice fed the high-cholesterol, high-fat (HCHF) diet weighed 11% more than Chow-fed controls. To induce small changes in body weight, mice in the Chow_DR (dietary restriction) and HCHF_DR groups underwent daily 15-hour time-restricted feeding (5:00 p.m. to 8:00 a.m.) while maintaining ad libitum access to water. This intervention reduced body weight gain by 8.37% and 5.18% in the Chow_DR and HCHF_DR groups, respectively.
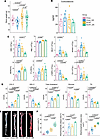 Figure 1
Time-restricted feeding exacerbates hypercholesterolemia and atherosclerosis despite reducing body weight in ApoE-deficient mice. (A) Final body weight of mice after 6 months of dietary intervention (n = 14). (B) Plasma corticosterone concentrations measured at study completion. (C) Peripheral blood cell analysis, including white blood cells (WBC), red blood cells (RBC), neutrophils (NEUT), monocytes (MONO), monocyte percentage (MONO%), platelet large cell ratio (P-LCR), lymphocytes (LYMPH), and eosinophils (EO). (D) Plasma lipid and metabolic parameters, including LDL cholesterol (LDL-C), HDL cholesterol (HDL-C), total cholesterol, glucose, and triglycerides (TG) (n = 4). (E) Representative en face Oil Red O–stained aortas from each experimental group. Scale bars: 2 mm. (F) Quantification of total aortic lesion area, brachiocephalic artery plaque area (%), and brachiocephalic plaque area (mm2) (n = 4). Data are shown as mean ± SEM; violin plots display the distribution of individual values with the median and interquartile range. Statistical significance was determined using an unpaired 2-tailed Student’s t test or the 2-sided Wilcoxon rank-sum (Mann-Whitney U) test, as appropriate. Exact P values are shown in the figures, followed by superscript “a” for an unpaired, 2-tailed Student’s t-test or superscript “b” for a two-sided Wilcoxon rank-sum (Mann–Whitney U) test.
The Chow and HCHF diets differed in energy density by 18.5% (367 versus 435 kcal/100 g; Supplemental Table 3). Despite the higher caloric density of the HCHF diet, HCHF-fed mice consumed less food than Chow-fed controls (2.64 versus 3.43 g/day), resulting in a 9.4% lower daily energy intake (11.52 versus 12.60 kcal/animal/day). Time-restricted feeding produced only modest additional reductions in food intake (0.10 g/day in Chow_DR and 0.15 g/day in HCHF_DR mice), corresponding to decreases in daily energy intake of 0.367 and 0.652 kcal/animal/day (2.9% and 5.5%, respectively). Over 1 month, these differences translated into cumulative energy deficits of approximately 335 and 519 kcal/kg body weight.
To determine whether time-restricted feeding induced physiological stress, we measured circulating corticosterone concentrations. Corticosterone levels were comparable between ad libitum–fed and time-restricted mice, indicating that the feeding regimen did not activate the hypothalamic-pituitary-adrenal axis. Interestingly, corticosterone concentrations exhibited greater interindividual variability in ad libitum–fed mice (Figure 1B).
Together, these findings indicate that the modest differences in body weight among the intervention groups were attributable to only small differences in cumulative energy intake and were not associated with activation of the physiological stress response.
Dietary restriction and HCHF feeding remodel circulating immune cell populations. Hematological analysis revealed consistent remodeling of circulating blood cell populations across the dietary intervention groups (Figure 1C). Total white blood cell counts were substantially reduced across all intervention groups, reaching statistical significance for the Chow_DR versus HCHF_DR comparison. In contrast, red blood cell counts were significantly increased in HCHF-fed compared with Chow-fed animals. Absolute neutrophil counts showed an increasing trend in Chow_DR mice and were significantly elevated following HCHF feeding. Absolute monocyte counts also tended to increase in Chow_DR- and HCHF-fed mice, although these changes did not reach statistical significance; however, monocyte frequency was significantly increased when expressed as a percentage of total leukocytes. In parallel, absolute lymphocyte counts progressively declined, with the magnitude of reduction increasing in the order Chow_DR < HCHF < HCHF_DR, indicating a shift toward neutrophil predominance. Absolute eosinophil counts were likewise reduced, reaching statistical significance in Chow_DR and HCHF mice. The platelet large cell ratio (P-LCR), an indicator of increased platelet size and activation, was elevated in all intervention groups, with the greatest increase observed in HCHF-fed mice.
Collectively, these findings demonstrate selective remodeling of circulating blood cell populations in response to dietary intervention, characterized by leukopenia, progressive lymphopenia, relative monocytosis, neutrophil predominance, and increased platelet size.
Blood biochemistry. Given the extensive characterization of plasma lipoprotein profiles in ApoE-deficient mice, circulating lipid measurements were performed in a satellite cohort only. As expected, the HCHF diet markedly increased circulating LDL cholesterol (LDL-C), with concentrations exceeding sixfold those of ad libitum Chow-fed mice (absolute difference, 6.6 mmol/L). Unexpectedly, time-restricted feeding also increased LDL-C in Chow-fed mice, resulting in a greater than 3-fold increase relative to ad libitum Chow-fed controls. LDL-C concentrations were highest in the HCHF_DR group, representing approximately 12-, 4-, and 2-fold increases compared with the Chow, Chow_DR, and HCHF groups, respectively (Figure 1D).
HDL cholesterol (HDL-C) concentrations were significantly reduced in all intervention groups. Relative to ad libitum Chow-fed controls, HDL-C declined by 41.6% in Chow_DR mice, 74.3% in HCHF-fed mice, and 67.8% in HCHF_DR mice. HDL-C concentrations did not differ significantly between the HCHF and HCHF_DR groups, indicating that time-restricted feeding did not further alter HDL-C under HCHF conditions (Figure 1D).
As expected, the HCHF diet nearly doubled circulating total cholesterol concentrations compared with ad libitum Chow-fed mice. Unexpectedly, time-restricted feeding also increased total cholesterol by approximately 2-fold in Chow-fed animals, despite the absence of a cholesterol-enriched diet. The greatest increase was observed in the HCHF_DR group, in which circulating cholesterol reached 2.7-fold above Chow-fed controls. These findings demonstrate that, even a modest reduction in energy intake markedly elevates circulating cholesterol concentrations in ApoE-deficient mice, irrespective of whether animals are maintained on Chow or HCHF diets
Time-restricted feeding also significantly reduced blood glucose concentrations, while values remained within the physiological range reported for ApoE-deficient mice, consistent with improved glucose homeostasis.
Circulating triglyceride (TG) concentrations were significantly reduced in Chow_DR mice compared with ad libitum Chow-fed controls and were similarly lower in HCHF_DR than in HCHF-fed animals. The reduction in plasma TG concentrations in Chow_DR mice is consistent with the metabolic adaptations associated with mild caloric restriction. In contrast, the lower TG concentrations observed under HCHF conditions coincided with an approximately 80-fold induction of Ces1g, a hepatic carboxylesterase implicated in intracellular TG mobilization, enhanced fatty acid oxidation, and reduced VLDL-TG secretion. However, because ApoE deficiency profoundly impairs the clearance of TG-rich lipoprotein remnants, the reduction in circulating TG likely reflects the combined effects of altered hepatic VLDL production and defective remnant metabolism rather than Ces1g induction alone.
Collectively, these findings reveal a paradoxical plasma lipid phenotype in ApoE-deficient mice in which mild dietary restriction markedly increased circulating cholesterol despite reducing blood glucose and TG concentrations. These changes point to profound remodeling of hepatic lipid metabolism and lipoprotein homeostasis, prompting further mechanistic analyses of hepatic cholesterol handling and lipid remodeling.
Dietary restriction paradoxically accelerates atherosclerotic plaque progression and destabilization. Atherosclerotic lesion burden was first quantified by en face Oil Red O staining of the entire aorta (Figure 1E). Lesion area was measured using ImageJ (NIH) in combination with the Weka machine-learning segmentation algorithm. Compared with ad libitum Chow-fed controls, all dietary interventions increased the percentage of aortic surface covered by lesions, with the greatest lesion burden observed in HCHF_DR mice, followed by HCHF-fed animals, whereas the increase in Chow_DR mice did not reach statistical significance (Figure 1F). Similar findings were obtained in the brachiocephalic artery, where plaque area was significantly increased in all intervention groups. Plaque burden was comparable between Chow_DR and HCHF mice but was significantly greater in HCHF_DR mice than in HCHF-fed animals. Quantification of absolute plaque area yielded the same pattern, increasing in the order Chow_DR < HCHF < HCHF_DR.
To independently validate these findings, atherosclerosis in the aortic arch was evaluated by H&E, Oil Red O, and Elastic van Gieson (EvG) staining (Figure 2A). Machine learning–based lesion segmentation confirmed a progressive increase in lesion area across the intervention groups (Chow_DR < HCHF < HCHF_DR) (Figure 2B). Plaque number followed the same trajectory, demonstrating a stepwise increase from Chow_DR to HCHF and HCHF_DR. Likewise, absolute plaque area progressively increased, with HCHF_DR mice exhibiting both the highest plaque burden and the largest individual lesions. These independent analyses consistently demonstrate that even modest dietary restriction unexpectedly accelerates atherosclerotic lesion development in ApoE-deficient mice, particularly in the setting of a cholesterol-rich HCHF diet.
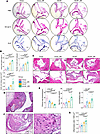 Figure 2
Time-restricted feeding accelerates atherosclerotic plaque progression and promotes features of plaque vulnerability in ApoE-deficient mice. (A) Representative images of the aortic arch stained with H&E, Oil Red O, and Elastic van Gieson (EvG) from the Chow, Chow_DR, HCHF, and HCHF_DR groups. Scale bars: 500 μm. (B) Quantification of aortic arch lesion area (%), plaque number, and total plaque area (n = 9). (C) Representative H&E-stained cross-sections of the aortic root. Lower panels show higher-magnification views of the boxed regions. Scale bars: 200 μm (upper panels) and 50 μm (lower panels). (D) Representative H&E-stained section of the brachiocephalic artery illustrating measurement of fibrous cap thickness (black dashed line), delineation of the necrotic core (red dashed outline), and measurement of intimal (I) and medial (M) thicknesses used to calculate the intima/media ratio (IMR). Scale bar: 50 μm. (E) Quantification of fibrous cap thickness, necrotic core area (expressed as a percentage of total plaque area), and IMR in brachiocephalic artery lesions (n = 9). (F) Representative H&E-stained brachiocephalic artery lesion showing inflammatory cell infiltration. The right panel shows a higher-magnification view of the boxed region; arrows indicate foamy macrophages within the lesion. Scale bars: 50 μm. (G) Quantification of inflammatory cell density in brachiocephalic artery lesions, expressed as inflammatory cells per 1,000 μm2 (n = 9). Data are presented as mean ± SEM. Statistical significance was determined using an unpaired 2-tailed Student’s t test or the 2-sided Wilcoxon rank-sum (Mann-Whitney U) test, as appropriate. Exact P values are shown in the figures, followed by superscript “a” for an unpaired, 2-tailed Student’s t-test or superscript “b” for a two-sided Wilcoxon rank-sum (Mann–Whitney U) test.
To determine whether the increased plaque burden was accompanied by features of plaque progression, lesion morphology was examined in the aortic root, aortic arch, and brachiocephalic artery (Figure 2, C–E). Quantitative morphometric analyses were performed in the brachiocephalic artery because of its susceptibility to disturbed flow and its propensity to develop advanced fibroatheromatous lesions that closely resemble human atherosclerosis. Necrotic core area increased progressively in the order Chow_DR < HCHF < HCHF_DR, whereas fibrous cap thickness decreased accordingly, consistent with the development of increasingly vulnerable plaques. The intima/media ratio was significantly increased in all intervention groups, although among the intervention groups, only the difference between HCHF and HCHF_DR reached statistical significance.
To assess vascular inflammation, immune cell infiltration within brachiocephalic plaques was quantified using QuPath image analysis (Figure 2, F and G). Immune cell density was significantly increased in HCHF- and HCHF_DR-fed mice compared with Chow-fed controls, whereas Chow_DR mice exhibited only a modest, statistically nonsignificant increase (3.95 versus 4.17 cells/1,000 μm2).
Collectively, these findings demonstrate that mild dietary restriction paradoxically aggravates atherosclerosis in ApoE-deficient mice. Beyond increasing lesion burden, dietary restriction promotes morphological hallmarks of advanced and vulnerable plaques, including expansion of the necrotic core, thinning of the fibrous cap, enhanced immune cell infiltration, and adverse vascular remodeling. These effects are most pronounced when dietary restriction is combined with HCHF feeding.
Dietary restriction promotes hepatic proatherogenic lipid remodeling. To define the effects of dietary intervention on hepatic lipid homeostasis, we performed partial least squares discriminant analysis (PLS-DA). The PLS-DA score plot revealed close clustering of the Chow and Chow_DR groups, whereas HCHF- and HCHF_DR-fed mice formed distinct clusters, indicating marked remodeling of the hepatic lipidome in response to the HCHF diet (Figure 3A). Orthogonal PLS-DA (OPLS-DA) further resolved all pairwise comparisons, demonstrating distinct diet-specific lipidomic signatures (Figure 3B). To identify the lipid species driving group separation, variable importance in projection (VIP) scores were calculated, and lipids with VIP > 1.0 and P < 0.05 were considered discriminatory. Heatmaps of these lipids are shown in Figure 3C and comprise 70, 73, and 42 species in the HCHF versus Chow, HCHF_DR versus Chow_DR, and HCHF_DR versus HCHF comparisons, respectively. Hierarchical clustering robustly segregated samples according to dietary intervention, confirming highly reproducible remodeling of the hepatic lipidome. Discriminatory lipids exhibited reciprocal regulation between dietary groups and included multiple phospholipid classes, notably phosphatidylcholines (PC), phosphatidylethanolamines (PE), phosphatidylserines (PS), lysophosphatidylcholines (LPC), sphingomyelins (SM), cholesteryl esters (CE), and their corresponding fatty acyl species. Note that all 42 discriminatory lipid species identified in the HCHF_DR versus HCHF comparison were increased, indicating a coordinated hepatic lipid remodeling response to dietary restriction superimposed on HCHF feeding. To further identify the lipid species contributing most strongly to group discrimination, S-plots were generated from the OPLS-DA models (Figure 3D). These analyses identified discriminatory lipids across all major lipid classes and served as the basis for subsequent analyses of lipid species associated with the proatherogenic phenotype induced by dietary restriction.
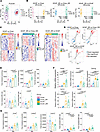 Figure 3
Time-restricted feeding induces hepatic lipidomic remodeling and alters cholesterol and bile acid metabolism. (A) Partial least squares-discriminant analysis (PLS-DA) score plot of hepatic lipidomic profiles demonstrating separation among the Chow, Chow_DR, HCHF, and HCHF_DR groups. (B) Orthogonal PLS-DA (OPLS-DA) score plots for pairwise comparisons between HCHF and Chow, HCHF_DR and Chow_DR, and HCHF_DR, and HCHF. (C) Heatmaps of differentially abundant hepatic lipid species identified in the indicated pairwise comparisons. (D) OPLS-DA S-plots highlighting discriminant lipid species enriched (red) or depleted (blue) between groups. (E) Hepatic concentrations of total cholesterol, free cholesterol, and total bile acids (BA), together with the total cholesterol/BA and free cholesterol/BA ratios (n = 10). (F) Relative hepatic mRNA expression levels of genes involved in cholesterol esterification and bile acid synthesis (Acat1, Acat2, Ces1g, Cyp7a1, and Cyp8b1) (n = 12). (G) Biliary concentrations of total cholesterol, free cholesterol, and total BA, together with the total cholesterol/BA and free cholesterol/BA ratios (n = 10). Data are presented as mean ± SEM. Statistical significance was determined using an unpaired 2-tailed Student’s t test or the 2-sided Wilcoxon rank-sum (Mann-Whitney U) test, as appropriate. Exact P values are shown in the figures, followed by superscript “a” for an unpaired, 2-tailed Student’s t-test or superscript “b” for a two-sided Wilcoxon rank-sum (Mann–Whitney U) test.
Cholesterol homeostasis. Bar charts in Figure 3, E and G, present quantitative analyses of total cholesterol, free cholesterol, total bile acids (BA), and the cholesterol/BA ratio in liver tissue and gallbladder bile.
Feeding mice a HCHF diet resulted in a 12.2% increase in total hepatic cholesterol compared with Chow-fed controls (2.78 mg/g versus 3.12 mg/g liver weight; Figure 3E). Although total cholesterol levels did not differ significantly between the ad libitum Chow and HCHF groups, free cholesterol was markedly elevated in HCHF-fed mice, showing a 65.5% increase (P = 0.00191). These findings closely parallel observations in human liver, where free cholesterol levels are elevated by 37.7% and 70.6% in MAFL and MASH cases, respectively (9).
Strikingly, mild dietary restriction produced distinct effects on hepatic cholesterol content depending on dietary background. In the Chow_DR group, total hepatic cholesterol decreased by 15.6% relative to ad libitum Chow-fed controls, though this reduction was not statistically significant. In contrast, mild dietary restriction in HCHF-fed mice (HCHF_DR group) led to a further 66.7% increase in free cholesterol, exceeding levels observed in the unrestricted HCHF group (P = 0.000276). Collectively, these data indicate that dietary restriction modulates hepatic cholesterol metabolism in a diet-dependent manner, with free cholesterol levels increasing nearly 3-fold in the HCHF_DR group compared with Chow-fed controls.
We next examined the hepatic expression of enzymes regulating cholesterol esterification, mobilization, and catabolism in ApoE-deficient mice. HCHF feeding significantly increased the expression of both Acat1 and Acat2 (Figure 3F). Although both enzymes catalyze the esterification of free cholesterol to CE, ACAT1 primarily mediates intracellular cholesterol sequestration to protect cells from free cholesterol–induced lipotoxicity, whereas ACAT2 is largely restricted to hepatocytes and enterocytes, where it generates CE for incorporation into ApoB-containing lipoproteins. Interestingly, time-restricted feeding further increased Acat1 expression under both dietary conditions, whereas Acat2 transcript abundance remained unchanged, suggesting preferential activation of intracellular cholesterol storage pathways rather than enhanced lipoprotein assembly.
Given the marked accumulation of hepatic free cholesterol, we next assessed the expression of Ces1g, a hepatic carboxylesterase that hydrolyses intracellular CE to release free cholesterol. Under Chow-fed conditions, time-restricted feeding increased Ces1g expression by approximately 3-fold (Figure 3F). HCHF feeding induced a striking ~80-fold increase in Ces1g transcript abundance, consistent with a robust adaptive response to hepatic cholesterol overload, whereas time-restricted feeding significantly attenuated this induction. As Ces1g is predominantly expressed in hepatocytes, its induction is likely to enhance the mobilization of stored CE, thereby increasing the availability of free cholesterol for downstream metabolic pathways.
To determine whether this mobilized cholesterol was directed toward BA synthesis, we examined the expression of Cyp7a1 and Cyp8b1, 2 key enzymes of the classical BA biosynthetic pathway. Both genes were robustly induced following HCHF feeding (approximately 50- and 11-fold, respectively) consistent with activation of hepatic cholesterol catabolism (Figure 3F), whereas time-restricted feeding did not further alter their expression.
Collectively, these findings demonstrate coordinated remodeling of hepatic cholesterol metabolism in response to dietary cholesterol overload. The concomitant induction of Acat1 and Acat2 is consistent with enhanced esterification and temporary sequestration of excess free cholesterol, while the marked induction of Ces1g suggests increased mobilization of CE stores. Together with the upregulation of Cyp7a1 and Cyp8b1, these data support increased hepatic cholesterol turnover, whereby excess cholesterol is dynamically esterified, remobilized, and directed toward BA synthesis. Consistent with this interpretation, hepatic BA content tended to be higher in HCHF-fed mice and was greatest in the time-restricted feeding group, although this difference did not reach statistical significance (Figure 3E).
Given the marked differences in dietary cholesterol intake and the central role of cholesterol as the precursor for BA synthesis, we next examined the hepatic cholesterol/BA ratio. Compared with Chow-fed controls, the total cholesterol/BA ratio was reduced by 23.7%, 15.2%, and 4.0% in the HCHF, Chow_DR, and HCHF_DR groups, respectively, although these differences did not reach statistical significance (Figure 3E). In contrast, the free cholesterol/BA ratio was significantly increased in the HCHF_DR group, indicating a disproportionate accumulation of hepatic free cholesterol relative to BA. This finding occurred despite a 49% increase in total hepatic cholesterol content in HCHF_DR mice, suggesting that the marked expansion of the hepatic cholesterol pool was not accompanied by a proportional increase in BA production. Collectively, these data indicate that time-restricted feeding under HCHF conditions alters hepatic cholesterol homeostasis, resulting in preferential accumulation of free cholesterol relative to its catabolism.
We next characterized the lipid composition of gallbladder bile (Figure 3G). Total biliary cholesterol concentrations were comparable between Chow and Chow_DR mice. In contrast, HCHF feeding nearly doubled biliary cholesterol, and dietary restriction in HCHF-fed mice produced a further 27% increase, although this difference did not reach statistical significance. Intriguingly, despite the HCHF diet contained substantially more cholesterol than the standard Chow diet (Supplemental Table 1), biliary cholesterol increased by only 2-fold, suggesting that hepatobiliary cholesterol secretion approaches saturation under conditions of chronic dietary cholesterol excess.
A similar pattern was observed for free cholesterol. Levels remained unchanged between Chow and Chow_DR mice, whereas HCHF feeding resulted in a nearly 2-fold increase that approached nearly statistical significance (P = 0.063). Dietary restriction further increased free cholesterol by 24% in HCHF-fed mice, although this effect likewise did not reach statistical significance.
Because excess hepatic cholesterol is normally converted into BA, we next quantified total biliary BA. Unexpectedly, BA concentrations tended to decline following HCHF feeding, decreasing by 10% in HCHF mice and by 23% in HCHF_DR mice, although neither change reached statistical significance. As a result, the cholesterol/BA ratio was significantly increased in HCHF-fed mice, irrespective of whether total or free cholesterol was used for the calculation, with the highest ratios observed in HCHF_DR mice. These findings indicate that dietary cholesterol loading disproportionately increases biliary cholesterol relative to BA secretion, an imbalance that is further accentuated by dietary restriction.
Dietary restriction exacerbates proatherogenic cholesterol ester remodeling in liver and bile. Previous studies identified distinct plasma CE species as strong predictors of cardiometabolic risk in large cohorts of patients with CVD and type 2 diabetes (10, 11). Building on these observations, we determined the hepatic and biliary CE composition with particular emphasis on clinically relevant atherogenic CE species. Although total hepatic CE content remained unchanged across dietary groups (Figure 4A), analysis at the molecular species level revealed marked diet-dependent remodeling.
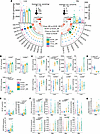 Figure 4
Time-restricted feeding remodels hepatic and biliary cholesteryl ester species. (A) Circular bubble heatmaps showing the abundance and composition of CE species in liver (left) and bile (right). Bubble size represents mean CE abundance (pmol/mg tissue for liver and nmol/mL for bile), and red arcs indicate the significance of group differences (−log10-transformed P values). (B) Distribution of hepatic CE subclasses containing saturated fatty acids (SFAs), monounsaturated fatty acids (MUFAs), and polyunsaturated fatty acids (PUFAs). (C) Hepatic abundance of selected atherogenic CE species. (D) Hepatic abundance of selected atheroprotective CE species. (E) Total CE abundance and subclass distribution (SFA-, MUFA-, and PUFA-containing CE species) in bile. (F) Biliary abundance of selected atherogenic CE species. (G) Biliary abundance of selected atheroprotective CE species. Data are presented as mean ± SEM (n = 10). Statistical significance was determined using an unpaired 2-tailed Student’s t test or the 2-sided Wilcoxon rank-sum (Mann-Whitney U) test, as appropriate. Exact P values are shown in the figures, followed by superscript “a” for an unpaired, 2-tailed Student’s t-test or superscript “b” for a two-sided Wilcoxon rank-sum (Mann–Whitney U) test.
In the liver, cholesterol esters containing saturated fatty acids (SFAs) and monounsaturated fatty acids (MUFAs) were significantly more abundant in Chow_DR than in HCHF_DR mice, whereas polyunsaturated fatty acid (PUFA)-containing CEs were markedly reduced by the HCHF diet, an effect that was not corrected by mild dietary restriction (Figure 4B). At the individual species level, the HCHF diet increased several CE species previously associated with atherosclerotic risk, including CE(14:0), CE(15:0), CE(16:1), CE(20:1), CE(20:2), CE(20:3), and CE(22:1) (Figure 4C). Mild dietary restriction further accentuated this proatherogenic profile by increasing CE(15:0) and CE(16:1), with a similar trend observed for CE(20:0) (P = 0.10). In contrast, the antiatherogenic species CE(18:2) was significantly depleted by the HCHF diet and remained suppressed despite dietary restriction (Figure 4D).
A comparable remodeling was observed in bile (Figure 4A). Mild dietary restriction produced a modest, nonsignificant increase in SFA-containing CEs, whereas the HCHF diet significantly increased MUFA- and PUFA-containing CE species (Figure 4E). Individual proatherogenic CE species, including CE(14:0), CE(16:1), CE(20:1), and CE(20:3), were significantly enriched following HCHF feeding (Figure 4F). Dietary restriction further increased CE(16:1), CE(20:0), CE(20:2), and CE(22:1), although these changes did not reach statistical significance. In contrast to the liver, biliary CE(18:2) showed a modest but nonsignificant increase in HCHF-fed mice (Figure 4G).
Collectively, these findings demonstrate that the HCHF diet profoundly remodels hepatic and biliary cholesterol ester composition toward a proatherogenic molecular signature. Mild dietary restriction failed to restore this lipid imbalance and, instead, further amplified several proatherogenic CE species, indicating that even modest energy restriction can aggravate cholesterol ester remodeling under conditions of dietary lipid excess.
HCHF feeding disrupts hepatobiliary phospholipid homeostasis. Hepatic and biliary phospholipid composition is summarized in Figure 5. Total hepatic phospholipid content was significantly reduced in HCHF-fed mice compared with Chow-fed controls (P = 0.000143). Time restricted feeding restored hepatic phospholipid levels in HCHF_DR mice to near-control values but had no effect in Chow-fed animals (Figure 5A), indicating that this response is specific to the HCHF dietary context.
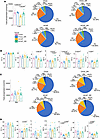 Figure 5
Time-restricted feeding alters phospholipid abundance and class composition. (A and B) Total hepatic phospholipid abundance and relative abundance of major phospholipid classes (PC, PE, LPC, SM, Cer, PS, and PE[P]). (C and D) Total biliary phospholipid abundance and relative abundance of major phospholipid classes. Pie charts display average class composition. Data are presented as mean ± SEM (n = 10). Statistical significance was determined using an unpaired 2-tailed Student’s t test or the 2-sided Wilcoxon rank-sum (Mann-Whitney U) test, as appropriate. Exact P values are shown in the figures, followed by superscript “a” for an unpaired, 2-tailed Student’s t-test or superscript “b” for a two-sided Wilcoxon rank-sum (Mann–Whitney U) test.
The relative distribution of hepatic phospholipid classes is illustrated in the pie charts (Figure 5A), with quantitative analyses shown in Figure 5B. The 2 major phospholipid classes, PC and PE, were unchanged across all experimental groups. In contrast, lysophospholipids were reduced following HCHF feeding, with the largest differences observed between Chow_DR and HCHF_DR mice. HCHF feeding also altered sphingolipid metabolism. Hepatic SM abundance increased by approximately 37%, reaching statistical significance only in HCHF_DR mice. Likewise, ceramide levels were elevated by approximately 80% in response to the HCHF diet; however, this increase was significantly attenuated by mild dietary restriction in HCHF_DR animals. In Chow-fed mice, dietary restriction significantly reduced PS while increasing PE plasmalogens (PE[P]) relative to ad libitum–fed controls.
The phospholipid composition of gallbladder bile exhibited a distinct response to diet and dietary restriction (Figure 5C), with quantitative analyses shown in Figure 5D. Total phospholipid content and PC abundance remained unchanged across all experimental groups. Although PE declined from 20.1% to 14.9% in Chow_DR mice, this difference did not reach statistical significance (P = 0.118). Moreover, because PE abundance was comparable between Chow- and HCHF-fed mice, the statistical difference observed between Chow_DR and HCHF_DR is unlikely to represent a biologically meaningful dietary effect.
Time-restricted feeding consistently increased LPC in both dietary groups. In contrast, PS displayed a diet-dependent response, decreasing by 47% in HCHF-fed mice relative to Chow controls, followed by a 30% increase in HCHF_DR animals, although neither change reached statistical significance. Biliary SM also increased in response to dietary restriction and was elevated by 24% in HCHF-fed mice. Ceramide exhibited the most pronounced diet-dependent response, decreasing by 48% in Chow-fed mice subjected to dietary restriction but increasing by 60% in HCHF_DR animals. Finally, PE plasmalogens were significantly reduced by both HCHF feeding and dietary restriction in Chow-fed mice but were restored to near Chow control levels in HCHF_DR animals.
Collectively, these findings demonstrate that HCHF feeding induces pronounced remodeling of the hepatic phospholipidome, characterized by depletion of total phospholipids and enrichment of ceramide. Time restricted feeding selectively restored total hepatic phospholipid content in HCHF-fed mice but failed to normalize the accompanying shift toward bioactive sphingolipids. In contrast, biliary phospholipid composition remained largely preserved, with only selective alterations in SM, ceramide, and plasmalogens, underscoring distinct regulatory mechanisms governing hepatic and biliary phospholipid homeostasis.
Dietary restriction amplifies SCD1-dependent PC remodeling in HCHF-fed mice. Figure 6A summarizes the hepatic PC acyl chain landscape. Bubble size denotes the relative abundance of individual PC species, whereas the central heatmap illustrates the statistical significance of group comparisons, with color intensity corresponding to the –log10(P value) (range, P < 0.05 to P < 1 × 10–11). Only PC species exhibiting significant differences in at least 1 dietary comparison are shown. Dietary groups are color-coded as Chow (pink), Chow_DR (blue), HCHF (yellow), and HCHF_DR (green).
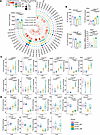 Figure 6
Time-restricted feeding remodels hepatic phosphatidylcholine species. (A) Circular bubble heatmap displaying the distribution and concentrations (pmol/mg tissue) hepatic PC species across diet groups. Bubble size represents average concentration (pmol/mg); red arcs indicate –log10-transformed P values from group comparisons. (B) Total abundance of SFA-, MUFA-, and PUFA-containing PC species. (C) Quantification of proatherogenic PC species in the liver. (D) Quantification of antiatherogenic PC species in the liver. Data are presented as mean ± SEM (n = 10). Statistical significance was determined using an unpaired 2-tailed Student’s t test or the 2-sided Wilcoxon rank-sum (Mann-Whitney U) test, as appropriate. Exact P values are shown in the figures, followed by superscript “a” for an unpaired, 2-tailed Student’s t-test or superscript “b” for a two-sided Wilcoxon rank-sum (Mann–Whitney U) test.
Total hepatic PC abundance was unchanged between Chow and Chow_DR mice (Figure 6A). In contrast, HCHF feeding significantly reduced total hepatic PC levels relative to Chow-fed controls. Mild dietary restriction had no effect in Chow-fed mice but restored hepatic PC abundance in HCHF_DR animals to levels comparable with those of Chow-fed controls.
To determine whether these changes reflected remodeling of PC acyl chain composition, PC species were grouped according to the class of their esterified fatty acids (Figure 6B). Despite the HCHF diet being enriched in SFAs, hepatic PC species containing SFA acyl chains were significantly reduced in HCHF-fed mice. Mild dietary restriction largely restored SFA-containing PC species to levels observed in Chow-fed controls. In contrast, MUFA-containing PC species were significantly increased by HCHF feeding and further enriched following dietary restriction, indicating a marked shift in PC composition from saturated toward monounsaturated acyl chains.
This remodeling closely paralleled the expression of stearoyl-CoA desaturase-1 (SCD1), the rate-limiting enzyme that converts saturated fatty acids into monounsaturated fatty acids. Scd1 expression was significantly reduced in Chow_DR mice but increased more than ninefold in HCHF-fed ApoE-deficient mice relative to Chow-fed controls. Dietary restriction superimposed on the HCHF diet triggered an even more pronounced transcriptional response, with Scd1 expression ranging from 12- to 240-fold (mean, 74-fold), representing the strongest induction of any lipid metabolic gene observed in this study. These transcriptional changes provide a mechanistic basis for the preferential incorporation of MUFAs into hepatic PC under conditions of dietary lipid excess and mild energy restriction.
Consistent with the low PUFA content of the milk fat–based HCHF diet, PC-bound PUFAs were markedly depleted, decreasing by approximately 50% in HCHF-fed mice and by 36% in HCHF_DR animals relative to Chow-fed controls.
Collectively, these findings demonstrate that HCHF feeding profoundly reprograms the hepatic PC acyl chain landscape through an SCD1-driven shift from saturated to monounsaturated species while depleting PUFA-containing PC, a remodeling that is further reinforced by mild dietary restriction
Dietary lipid excess remodels the hepatic phosphatidylcholineome toward an atherogenic signature. Independent lipidomic studies established strong associations between PC composition in liver, adipose tissue, and plasma and the severity of MASLD, obesity, and CVD (12–16). Building on these findings, we interrogated hepatic PC species with established pro- and antiatherogenic properties using a consensus panel derived from 4 independent clinical lipidomic studies encompassing nearly 500 patients with CVD.
As shown in Figure 6C and Supplemental Table 5, HCHF feeding markedly increased the abundance of several PC species previously associated with atherosclerotic risk, including PC(30:0), PC(32:1), PC(34:1), PC(36:1), PC(38:0), PC(O 32:0), PC(O 32:1), PC(O 34:0), and PC(O 34:1). Mild dietary restriction further augmented the accumulation of multiple proatherogenic species, most notably PC(32:1), PC(34:1), PC(36:1), PC(38:0), PC(O 32:0), PC(O 32:1), and PC(O 34:1), demonstrating that modest energy restriction unexpectedly intensified the hepatic enrichment of atherogenic PC molecular species.
We next examined PC species consistently associated with favorable cardiovascular outcomes in patients with coronary heart disease and coronary artery disease (16). HCHF feeding significantly depleted several cardioprotective PC species, including PC(36:4), PC(36:5), PC(38:4), PC(38:5), PC(38:6), PC(38:7), and PC(40:6) (Figure 6D and Supplemental Table 6), indicating a selective loss of phospholipids linked to cardiovascular protection. Mild dietary restriction partially modified this response by increasing PC(32:2) and PC(38:3) by 76% and 25%, respectively, although the overall cardioprotective PC signature remained markedly diminished.
To determine whether these changes extended to the hepatobiliary compartment, we quantified PC species in gallbladder bile (Supplemental Figure 2). Consistent with the hepatic lipidome, biliary PC species containing saturated and monounsaturated fatty acids were significantly enriched, whereas PUFA-containing species were markedly depleted. The HCHF diet significantly increased multiple proatherogenic PC species, including PC(30:0), PC(32:1), PC(34:1), PC(36:1), PC(38:0), PC(O 34:0), PC(O 34:1), and PC(O 38:5), and dietary restriction further enhanced the accumulation of PC(34:1) (Supplemental Table 7). Among cardioprotective species, PC(32:2), PC(38:3), and PC(40:7) were increased, whereas PC(36:4) and PC(38:4) were reduced (Supplemental Table 8).
Collectively, these findings demonstrate that HCHF feeding profoundly remodels the hepatic and biliary PC landscape, characterized by depletion of total PC, selective enrichment of proatherogenic molecular species, and loss of cardioprotective PC species. Time-restricted feeding failed to reverse this atherogenic remodeling and instead further amplified the accumulation of several high-risk PC species.
Dietary lipid excess selectively enriches proatherogenic PE and LPC molecular species. PE, the second-most abundant phospholipid class in the liver (Figure 7A), exhibited a modest 16% reduction following HCHF feeding, although this change did not reach statistical significance (P = 0.10). Mild dietary restriction restored total hepatic PE abundance to levels comparable with Chow-fed controls.
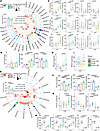 Figure 7
Time-restricted feeding differentially remodels hepatic phosphatidylethanolamine (PE) and lysophosphatidylcholine species (LPC). (A) Circular bubble heatmap displaying the concentrations (pmol/mg tissue) of PE species in the liver across different dietary groups. Bubble size indicates average concentration (pmol/mg); red arcs denote –log10 transformed P values from group comparisons. (B) Total hepatic phosphatidylethanolamine levels of saturated (SFA), monounsaturated (MUFA), and polyunsaturated (PUFA) PE species. (C) Quantification of proatherogenic PE species in the liver. (D) Quantification of antiatherogenic PE species in the liver. (E) Circular bubble heatmap displaying the concentrations (pmol/mg tissue) of LPC species in the liver across different dietary groups. Bubble size indicates average concentration (pmol/mg); red arcs denote –log10 transformed P values from group comparisons. (F) Total hepatic lysophosphatidylcholine levels of saturated (SFA), monounsaturated (MUFA), and polyunsaturated (PUFA) LPC species. (G) Quantification of proatherogenic LPC species in the liver. (H) Quantification of antiatherogenic LPC species in the liver. Data are presented as mean ± SEM (n = 10). Statistical significance was determined using an unpaired 2-tailed Student’s t test or the 2-sided Wilcoxon rank-sum (Mann-Whitney U) test, as appropriate. Exact P values are shown in the figures, followed by superscript “a” for an unpaired, 2-tailed Student’s t-test or superscript “b” for a two-sided Wilcoxon rank-sum (Mann–Whitney U) test.
To determine whether HCHF feeding altered PE molecular composition, PE species were grouped according to their esterified fatty acids (Figure 7B). SFA-containing PE species remained unchanged across all dietary groups. In contrast, MUFA-containing PE species were significantly enriched in HCHF-fed mice and increased further following dietary restriction. Conversely, PUFA-containing PE species were significantly depleted in both HCHF and HCHF_DR mice. Together, these findings demonstrate a diet-induced remodeling of the hepatic PE lipidome characterized by replacement of PUFA-containing species with MUFA-containing species, a trend that was further accentuated by dietary restriction (P = 0.062).
We next examined individual PE species previously associated with increased cardiovascular risk. HCHF feeding significantly increased several proatherogenic PE species, including PE(32:1), PE(34:1), PE(36:1), PE(36:5), and PE(38:2), but PE(O 36:2) did not reach statistical significance (Figure 7C). Mild dietary restriction further increased these species, although statistical significance was reached only for PE(32:1). In contrast, among PE species associated with favorable cardiovascular outcomes, only PE(36:6) was significantly increased in HCHF_DR mice relative to Chow_DR animals (Figure 7D).
The phospholipid composition of gallbladder bile showed a partially distinct pattern (Supplemental Figure 3). Total biliary PE content remained unchanged across all dietary groups. However, MUFA-containing PE species were significantly enriched following HCHF feeding, whereas PUFA-containing PE species were largely unaffected. At the molecular level, several proatherogenic PE species, including PE(32:1), PE(34:1), PE(36:5), PE(38:2), and PE(O 36:2), were significantly increased in bile from HCHF-fed mice, indicating that the proatherogenic remodeling observed in liver extends to the hepatobiliary compartment.
We next analyzed LPC, a bioactive phospholipid implicated in vascular inflammation and atherosclerosis. Total hepatic LPC abundance declined by 33% following HCHF feeding (Figure 7E). Despite this overall reduction, LPC composition underwent marked remodeling, with a shift from PUFA-containing toward MUFA-containing species (Figure 7F). Consistent with this pattern, the proatherogenic LPC(16:1) was significantly increased in HCHF_DR mice, whereas LPC(22:4) and LPC(22:5) were significantly reduced (Figure 7G). Several LPC species associated with cardiovascular protection, including LPC(16:0), LPC(18:0), LPC(18:2), and LPC(20:4), were also significantly depleted, while LPC(18:1) was increased (Figure 7H). Thus, despite a reduction in total hepatic LPC content, HCHF feeding selectively enriched LPC species linked to increased cardiovascular risk.
Analysis of gallbladder bile revealed comparable remodeling of LPC species (Supplemental Figure 4). Although total biliary LPC levels increased by more than 40% following dietary restriction, this change did not reach statistical significance. Similar to the liver, biliary LPC composition shifted from PUFA-containing toward MUFA-containing species. Moreover, the proatherogenic LPC(16:1) was significantly increased in HCHF-fed mice, whereas the cardioprotective LPC(18:2) was significantly reduced.
Collectively, these findings demonstrate that HCHF feeding coordinately remodels hepatic and biliary PE and LPC lipidomes toward a proatherogenic molecular signature characterized by enrichment of MUFA-containing and disease-associated lipid species and depletion of cardioprotective PUFA-containing phospholipids. Mild dietary restriction failed to reverse these changes and, for several lipid species, further accentuated the proatherogenic remodeling.
HCHF feeding and dietary restriction remodel hepatic sphingolipids toward an atherogenic profile. We next quantified hepatic SM and ceramide species, 2 sphingolipid classes with established roles in atherosclerosis and CVD (Figure 8A). Total hepatic SM abundance was significantly reduced following HCHF feeding but was restored to levels comparable to Chow-fed controls by time restricted feeding. Unlike the glycerophospholipid classes, SM species containing saturated (SFA), monounsaturated (MUFA), and polyunsaturated fatty acids (PUFA) were all significantly depleted in HCHF-fed mice. Note dietary restriction completely normalized these reductions (Figure 8B).
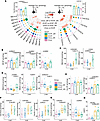 Figure 8
Time-restricted feeding remodels hepatic sphingomyelin and ceramide species. (A) Circular bubble heatmaps illustrating the composition and concentrations (pmol/mg tissue) of sphingomyelin species in the liver (left panel) and ceramides (right panel); red arcs denote –log10 transformed P values for group comparisons. (B) Total hepatic sphingomyelin levels of saturated (SFA), monounsaturated (MUFA), and polyunsaturated (PUFA) SM species. (C) Quantification of proatherogenic SM species in the liver. (D) Quantification of antiatherogenic SM species in the liver. (E) Total hepatic levels of Cer species grouped by saturation type. (F) Quantification of proatherogenic Cer species in the liver. (G) Quantification of antiatherogenic Cer species in the liver. (H) Ceramide risk score of CERT1 in the liver. Data are presented as mean ± SEM (n = 10). Statistical significance was determined using an unpaired 2-tailed Student’s t test or the 2-sided Wilcoxon rank-sum (Mann-Whitney U) test, as appropriate. Exact P values are shown in the figures, followed by superscript “a” for an unpaired, 2-tailed Student’s t-test or superscript “b” for a two-sided Wilcoxon rank-sum (Mann–Whitney U) test.
Analysis of individual SM species revealed selective remodeling of molecular species with established cardiovascular relevance. The proatherogenic species SM(16:0) and SM(24:1) were significantly enriched in HCHF_DR mice (Figure 8C). At the same time, dietary restriction increased the cardioprotective species SM(23:0) and SM(23:1), whereas SM(24:0), another cardioprotective species, was significantly reduced (Figure 8D), indicating a mixed effect of dietary restriction on the hepatic SM profile.
In contrast to SM, total hepatic ceramide content increased by approximately 30% following HCHF feeding and remained elevated despite dietary restriction (Figure 8A). Although ceramides containing SFA acyl chains increased modestly (approximately 15%) in both dietary restriction groups, these changes did not reach statistical significance. By comparison, MUFA-containing ceramides increased by approximately 38% in both HCHF-fed groups (Figure 8E). At the molecular level, HCHF feeding significantly increased the proatherogenic ceramide species Cer(16:0), Cer(18:0), and Cer(24:1), with no further effect of dietary restriction (Figure 8F). Among ceramide species associated with lower cardiovascular risk, Cer(23:0) was significantly increased, whereas Cer(24:0) was significantly reduced following HCHF feeding; both responses were unaffected by dietary restriction (Figure 8G).
To integrate these changes into a clinically relevant metric, we calculated the CERT1 ceramide risk score (Figure 8H). HCHF feeding significantly increased the mean CERT1 score to 7.5, which rose further to 8.1 in HCHF_DR mice, although the difference between the 2 HCHF groups was not statistically significant. Thus, mild dietary restriction failed to improve the ceramide-based cardiovascular risk profile. Instead, the persistently elevated CERT1 score is paralleled by the marked increase in atherosclerotic plaque burden observed in HCHF_DR mice (Figures 1 and 2).
We next examined sphingolipid composition in gallbladder bile (Supplemental Figure 5). In contrast to the liver, total biliary SM content increased significantly in response to dietary restriction (Supplemental Figure 5A). SFA-containing SM species were significantly enriched by HCHF feeding, whereas dietary restriction further increased MUFA-containing SM species by 150% in Chow_DR mice and 66% in HCHF_DR mice (Supplemental Figure 5B). PUFA-containing SM species were selectively increased only in Chow_DR animals. At the molecular level, dietary restriction significantly increased the proatherogenic SM species SM(16:0) and SM(24:1) in HCHF-fed mice (Supplemental Figure 5C).
Total biliary ceramide content was likewise significantly increased following HCHF feeding (Supplemental Figure 5A), with dietary restriction further enriching MUFA-containing ceramides (Supplemental Figure 5D). The proatherogenic Cer(24:1) remained elevated in HCHF-fed mice, whereas the cardioprotective Cer(23:0) increased and Cer(24:0) decreased in both Chow_DR and HCHF groups. Dietary restriction partially restored Cer(24:0) toward Chow control levels (P = 0.0303; Supplemental Figure 5F). Consistent with these molecular changes, the biliary CERT1 score was significantly elevated in HCHF-fed mice, reaching mean values of 5.2 and 6.9 in the HCHF and HCHF_DR groups, respectively.
Collectively, these findings demonstrate that HCHF feeding induces profound remodeling of hepatic and biliary sphingolipids, characterized by persistent enrichment of proatherogenic ceramide species and elevated CERT1 risk scores. Although time restricted feeding normalized total hepatic SM abundance, it failed to reverse the ceramide-associated cardiovascular risk signature and, in some cases, further increased proatherogenic sphingolipid species.


